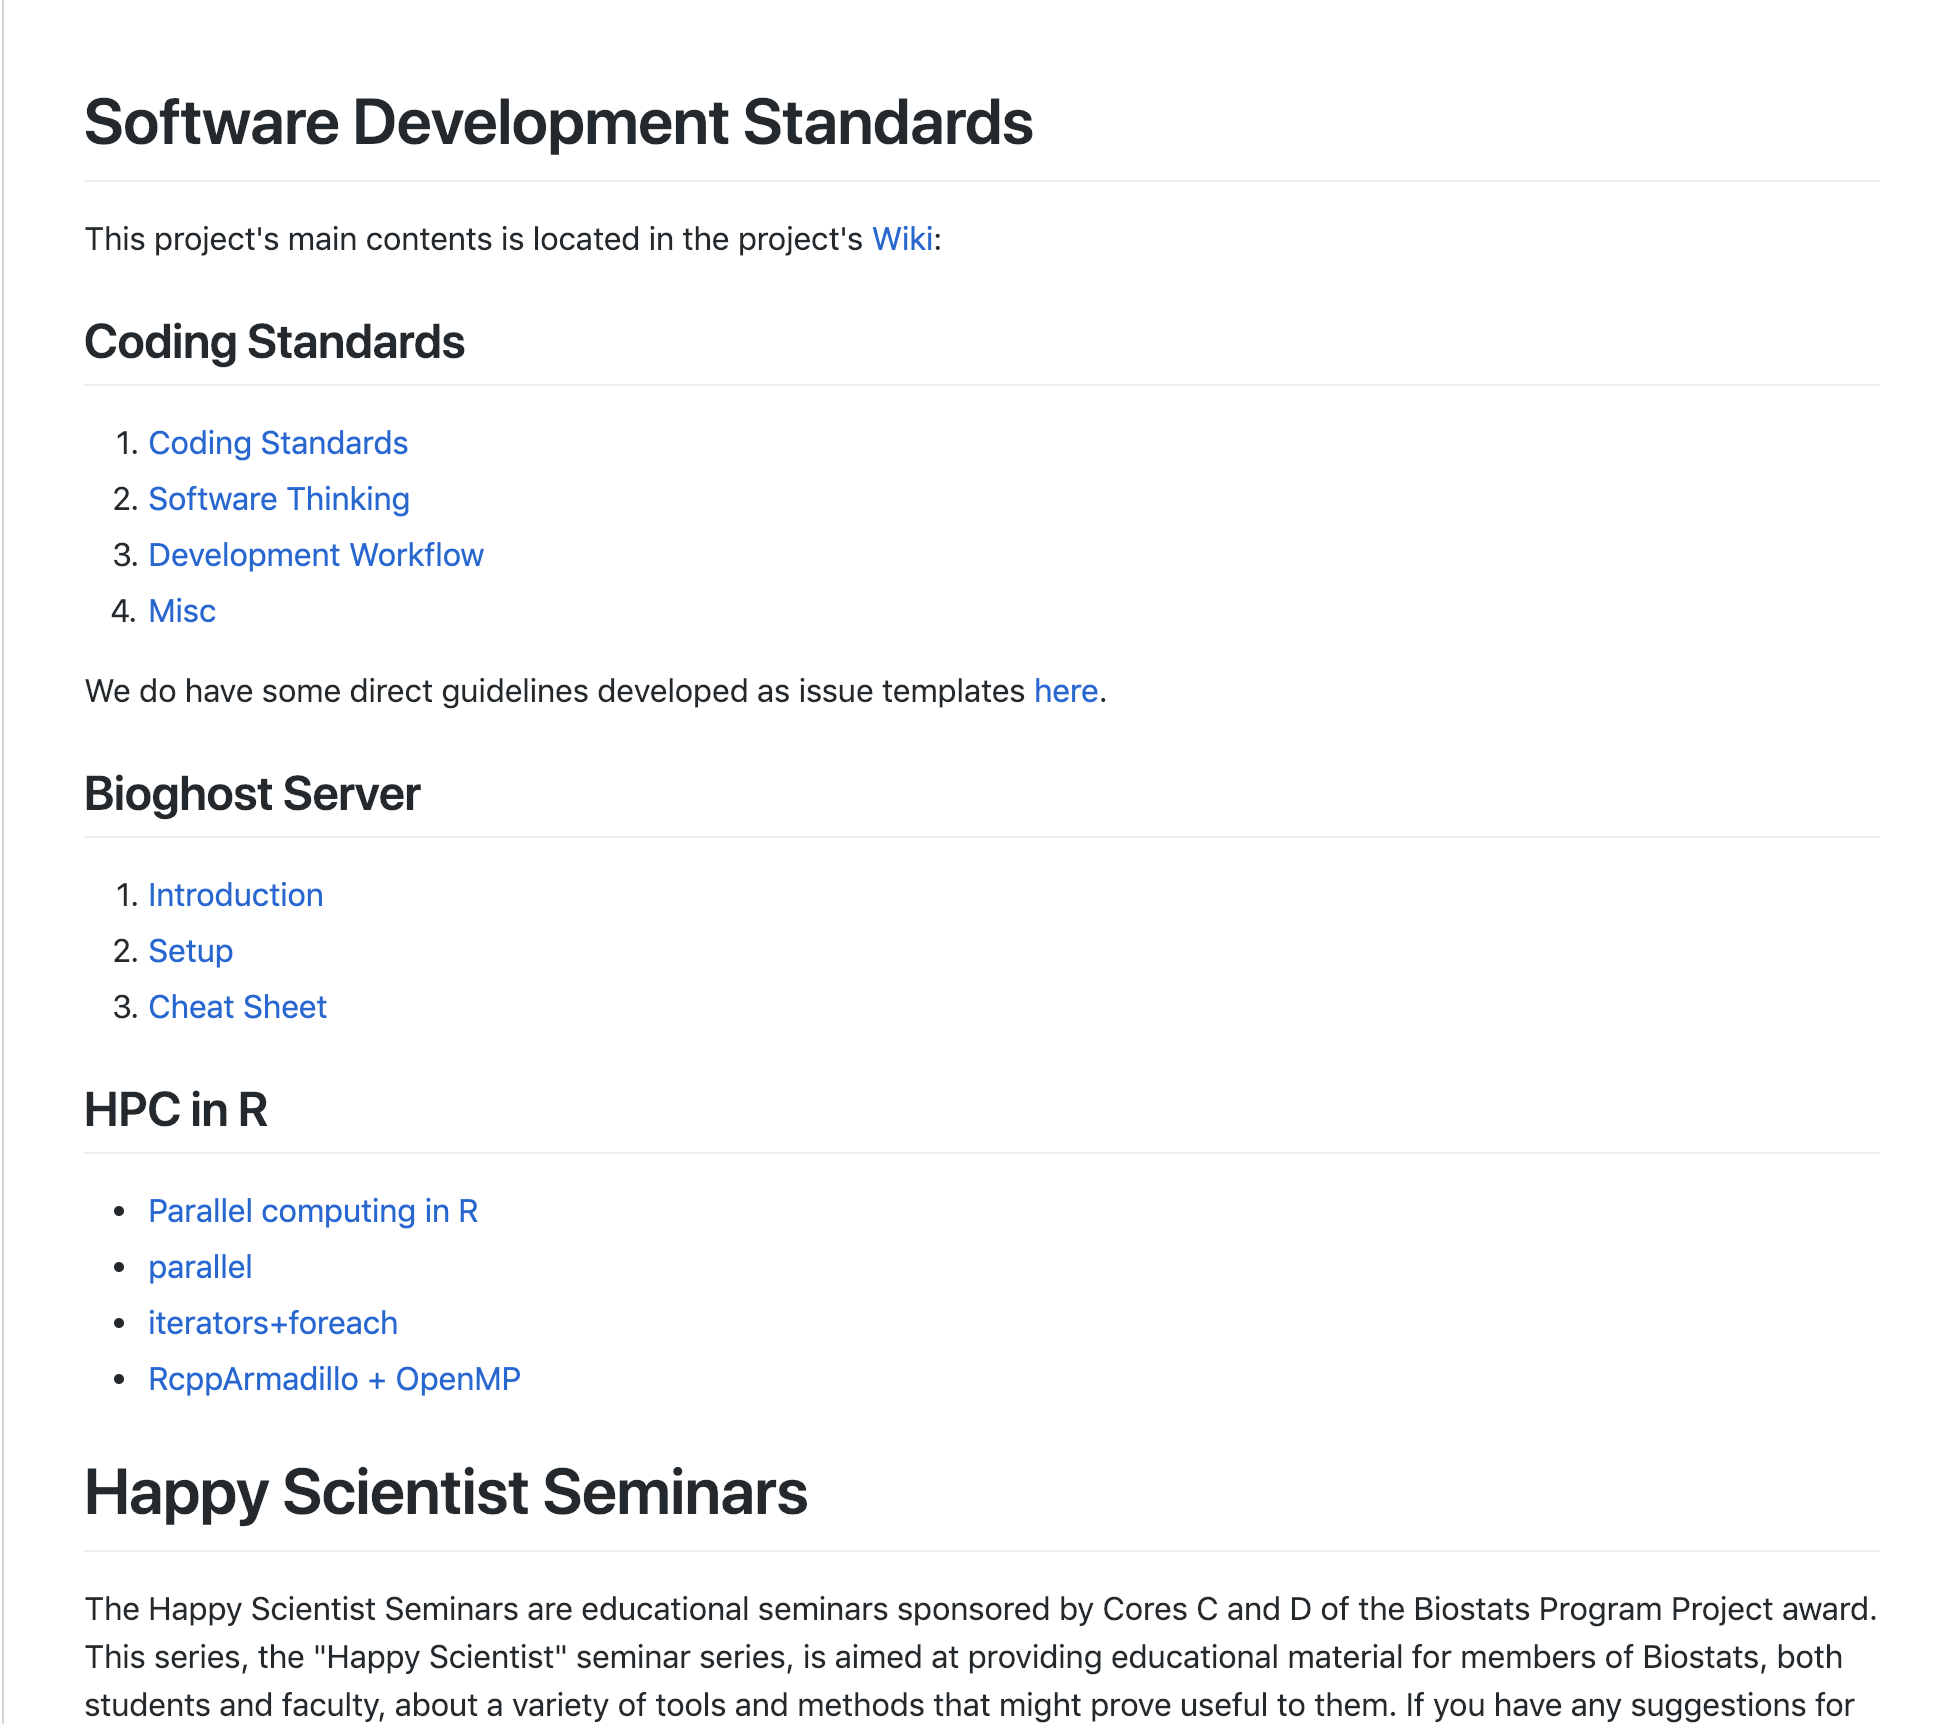
class: center, middle, title-slide # RStudio and R Resources ## Happy Scientist Seminar ### Emil Hvitfeldt ### 2019-1-22 --- # Motivation We will talk about what you are able to do in RStudio with R and where to find information and rescources to do it great. --- .pull-left[  - Data analysis scripts - Interactive web applications - Documents - Reports - Graphs - more ] .pull-right[ - Syntax highlighting - code completion - smart indentation - Integrated R help - data viewer - Version control with Git ] --- .center[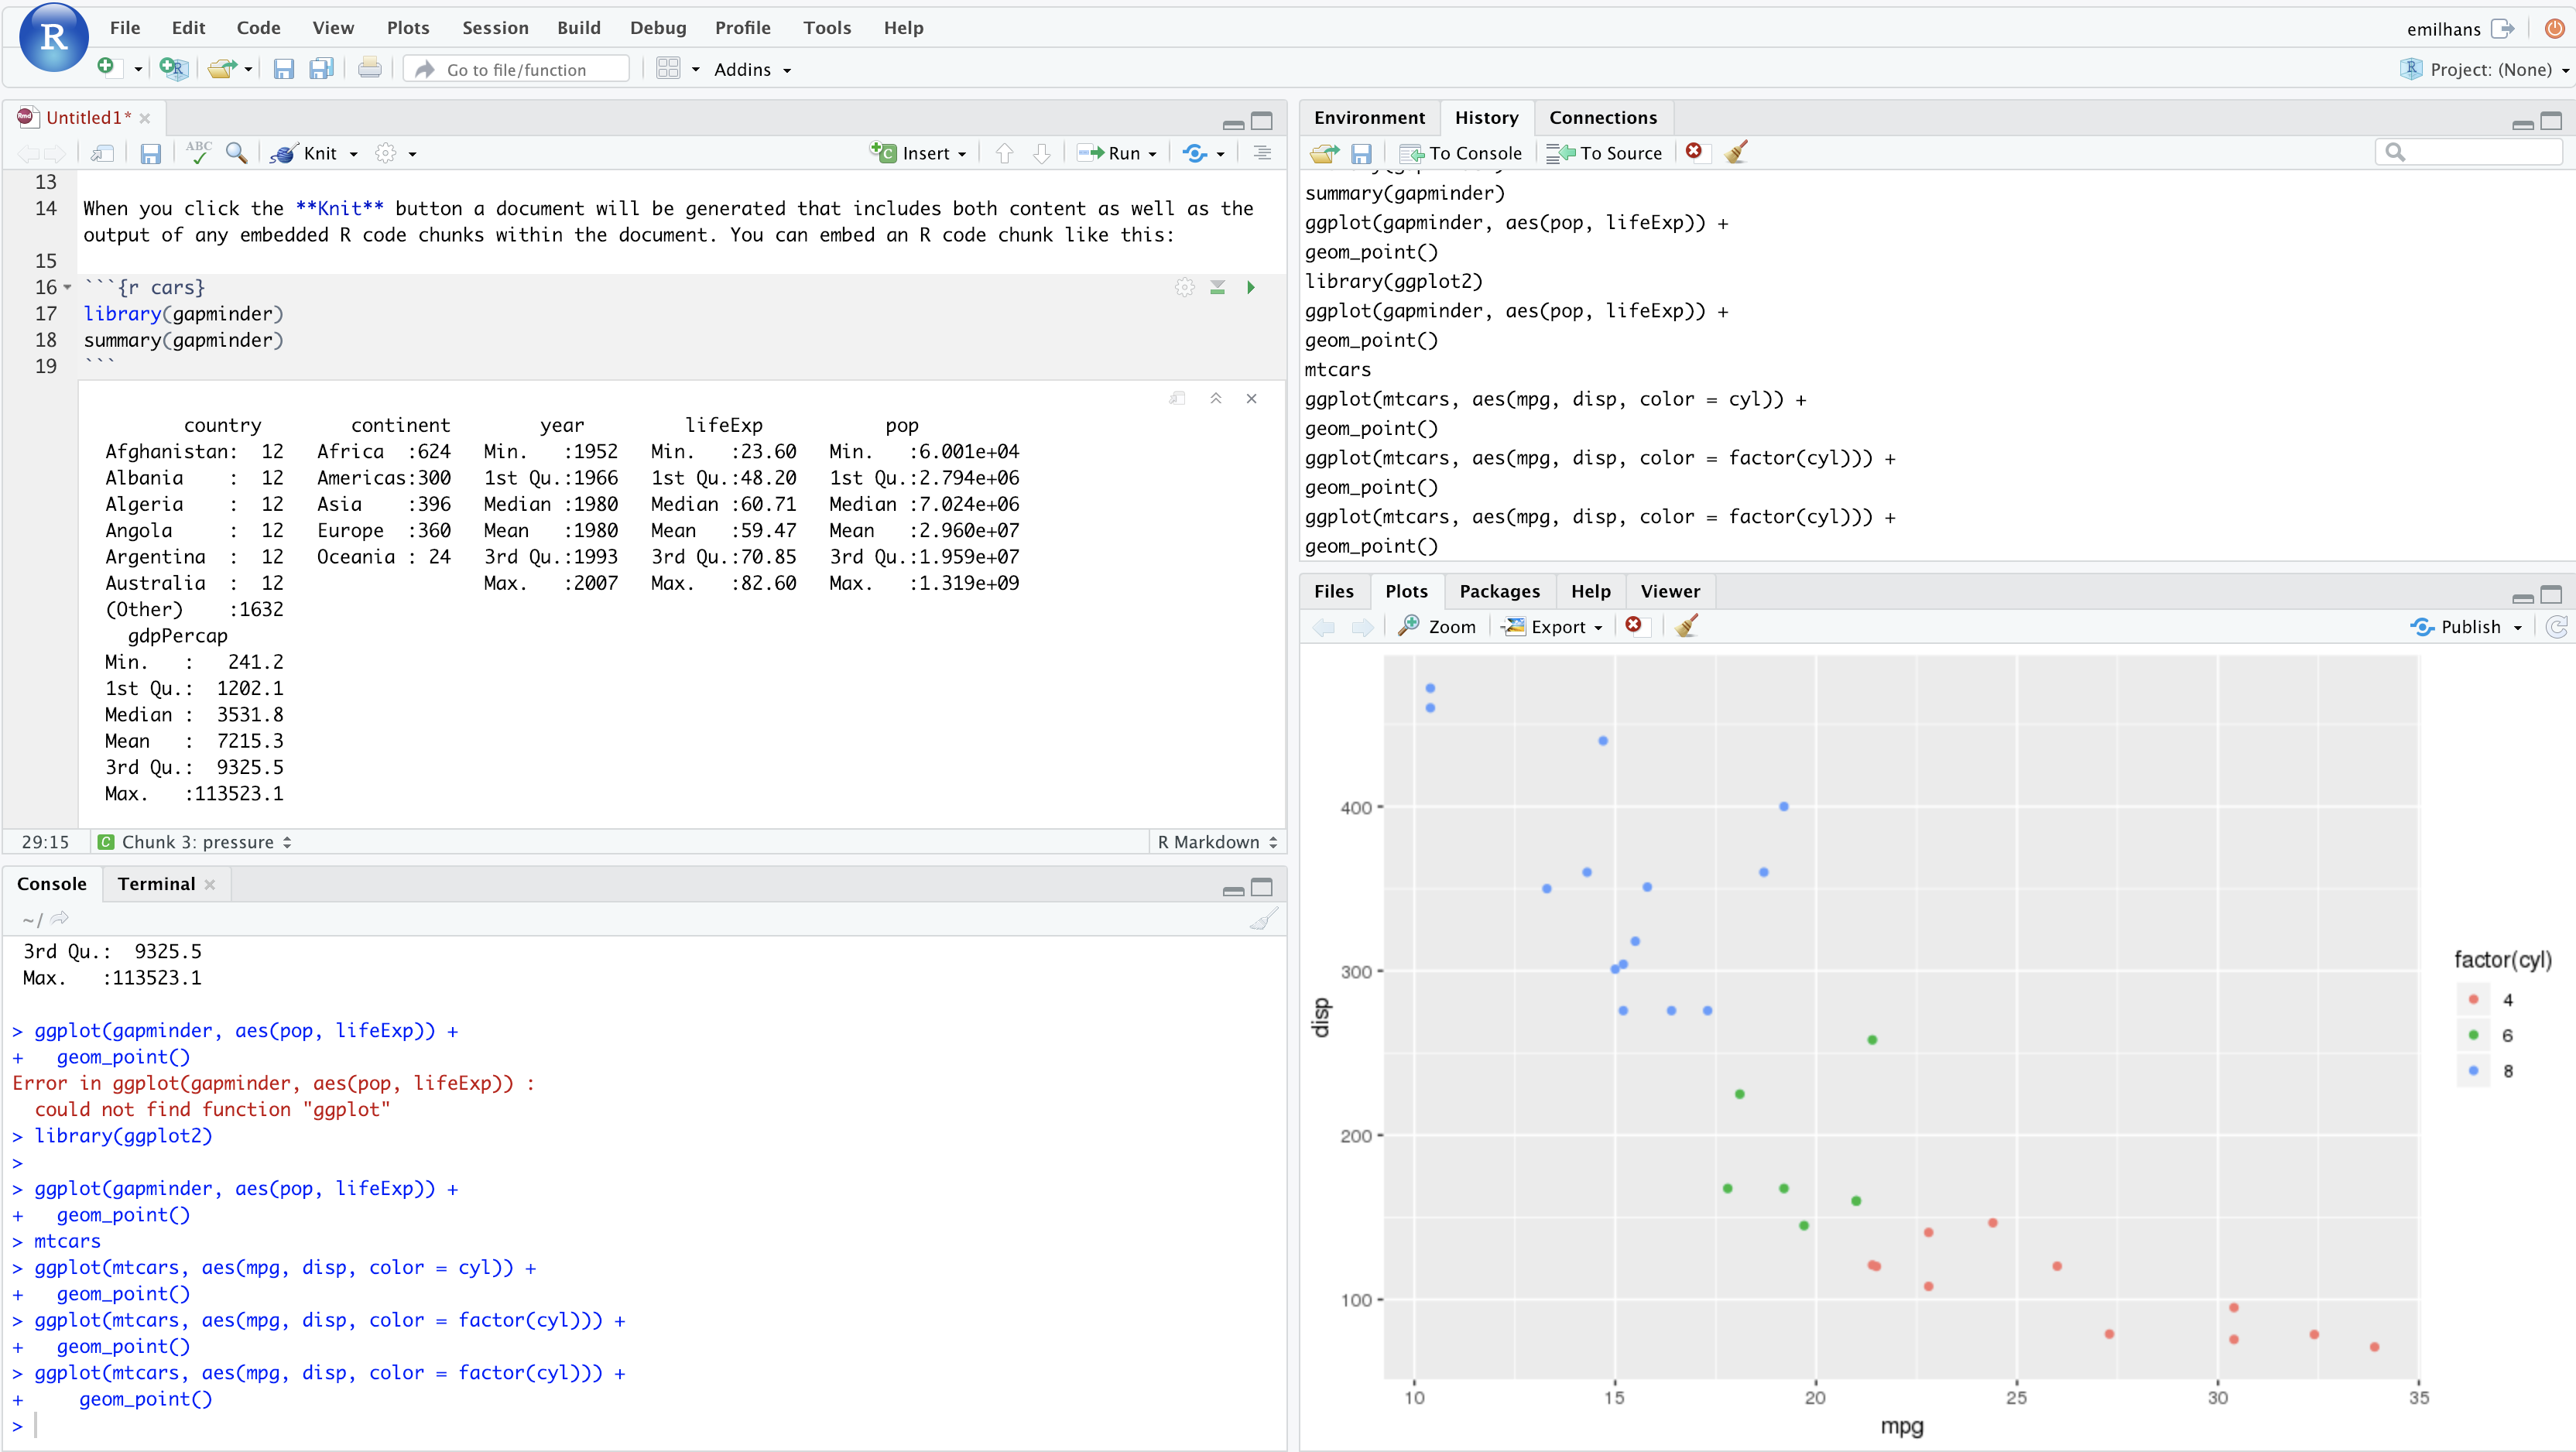] --- .center[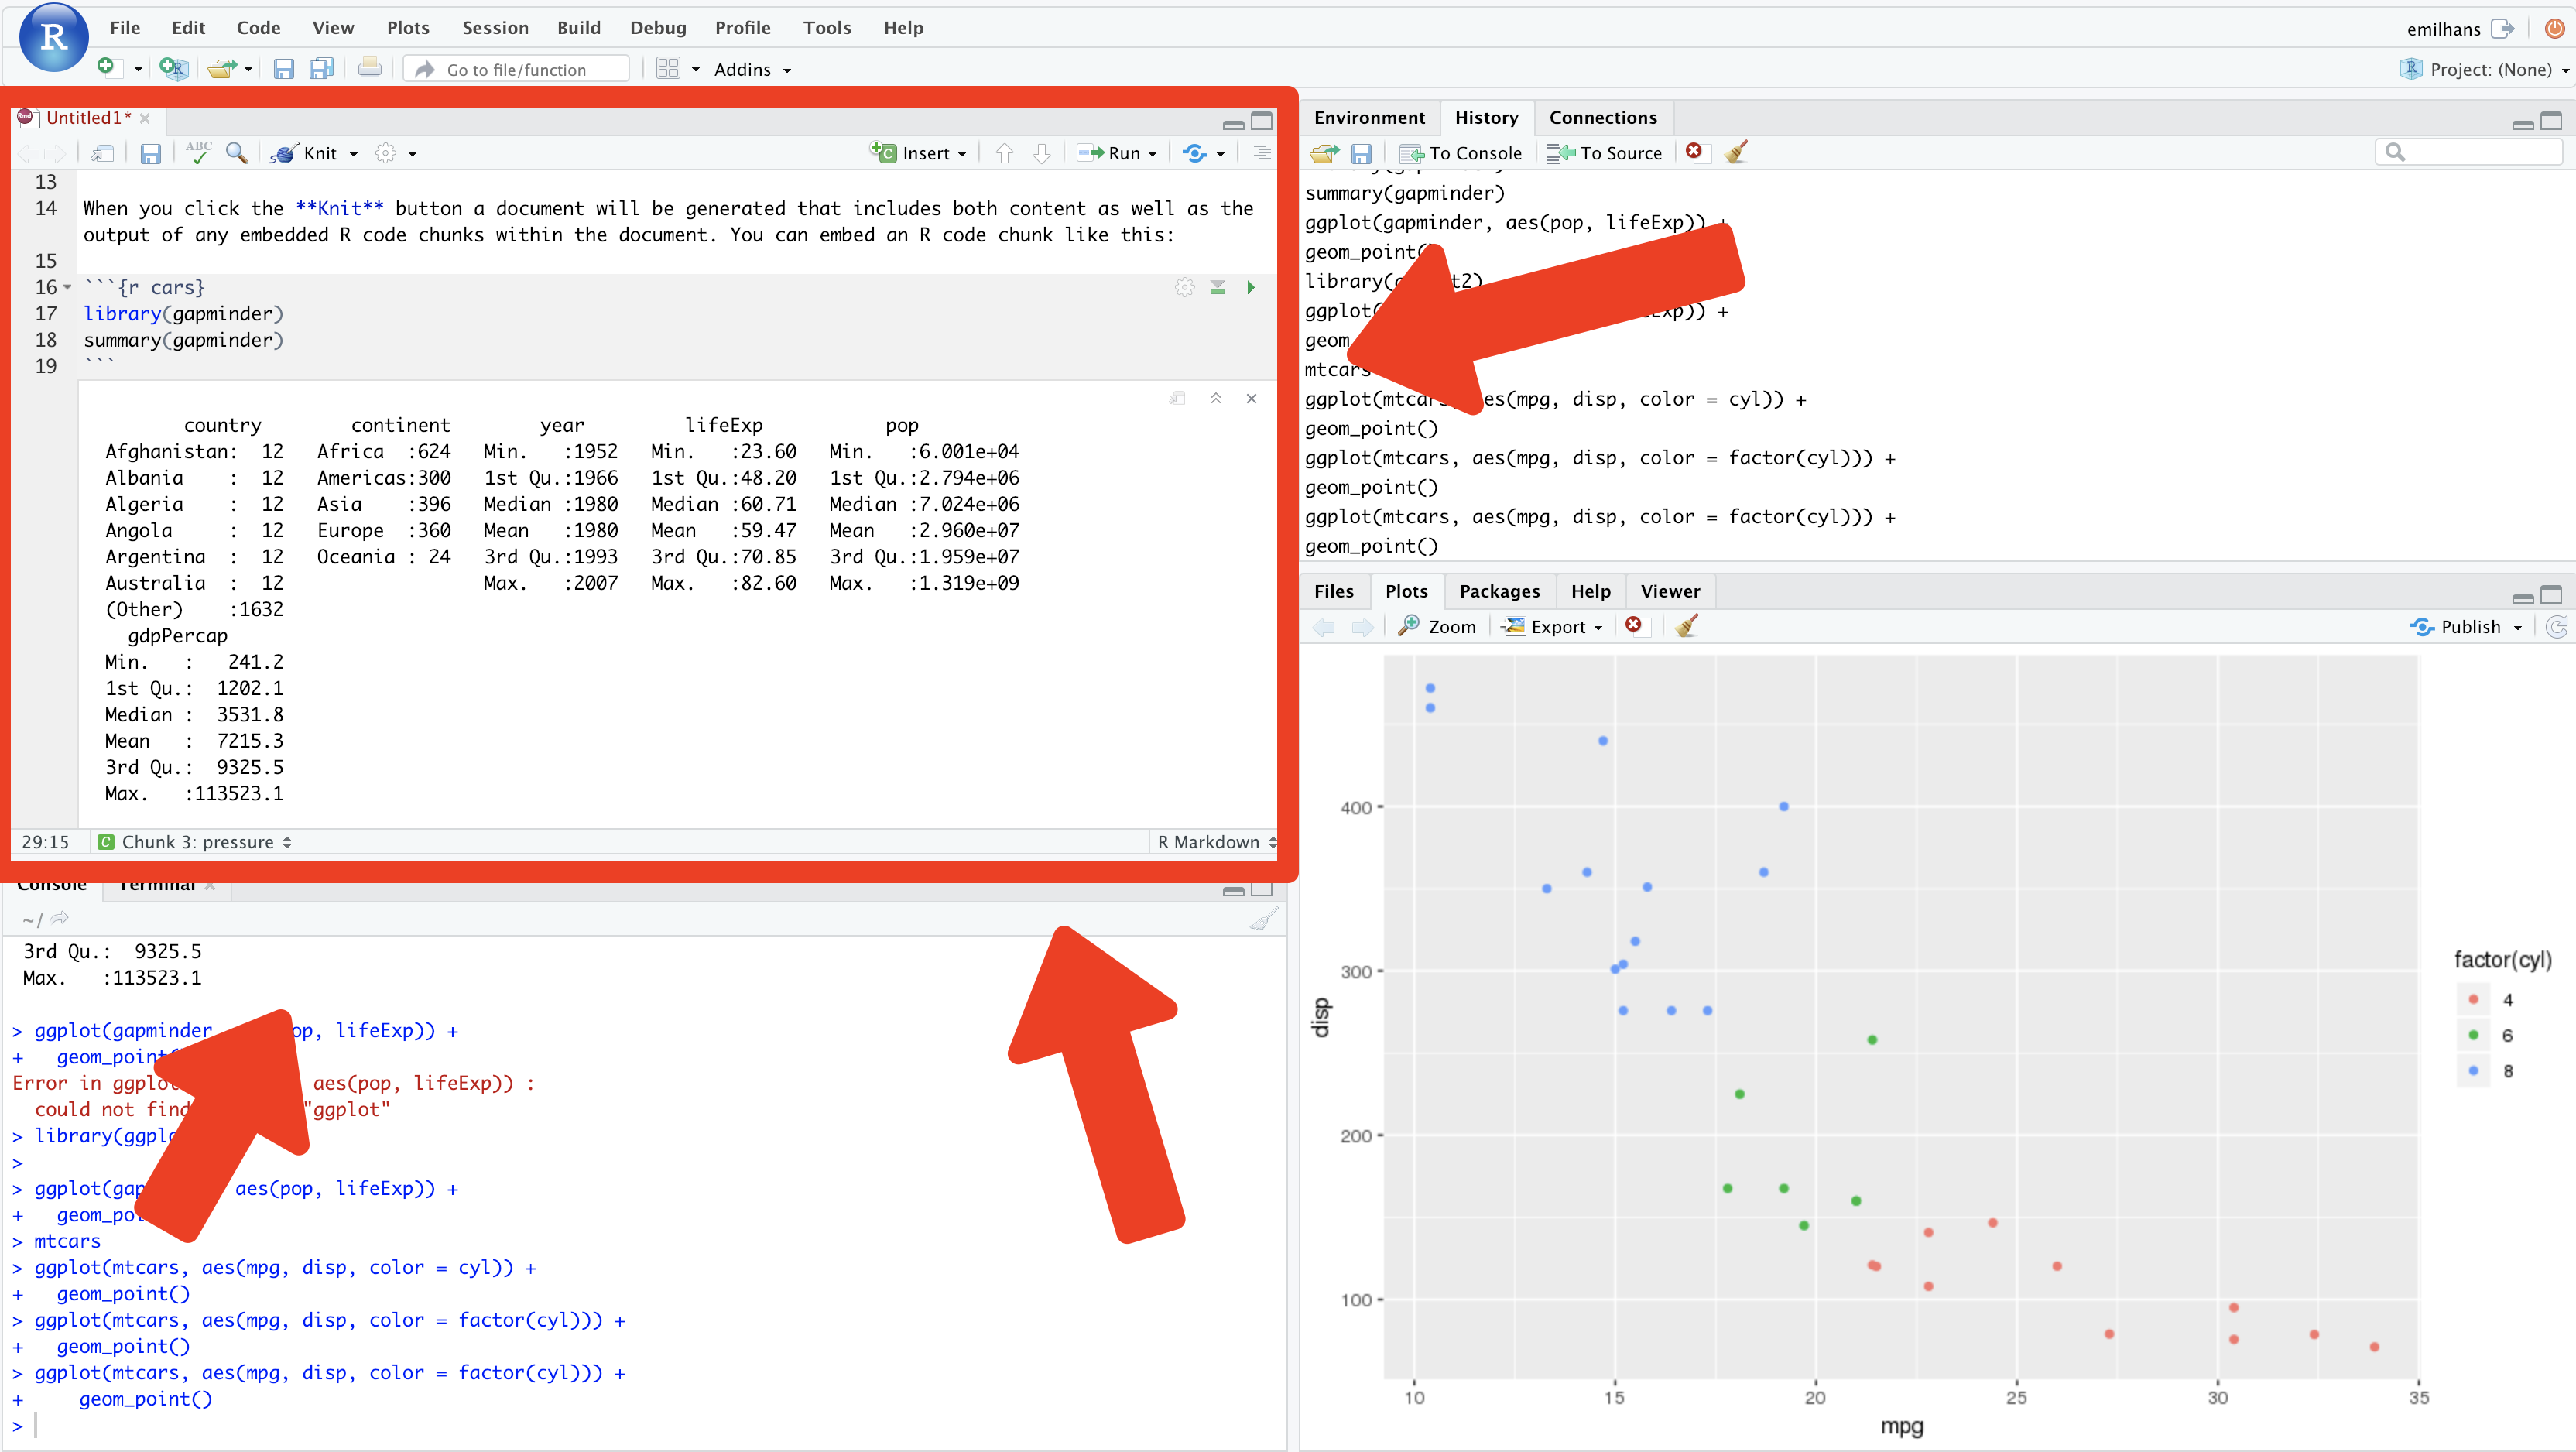] --- 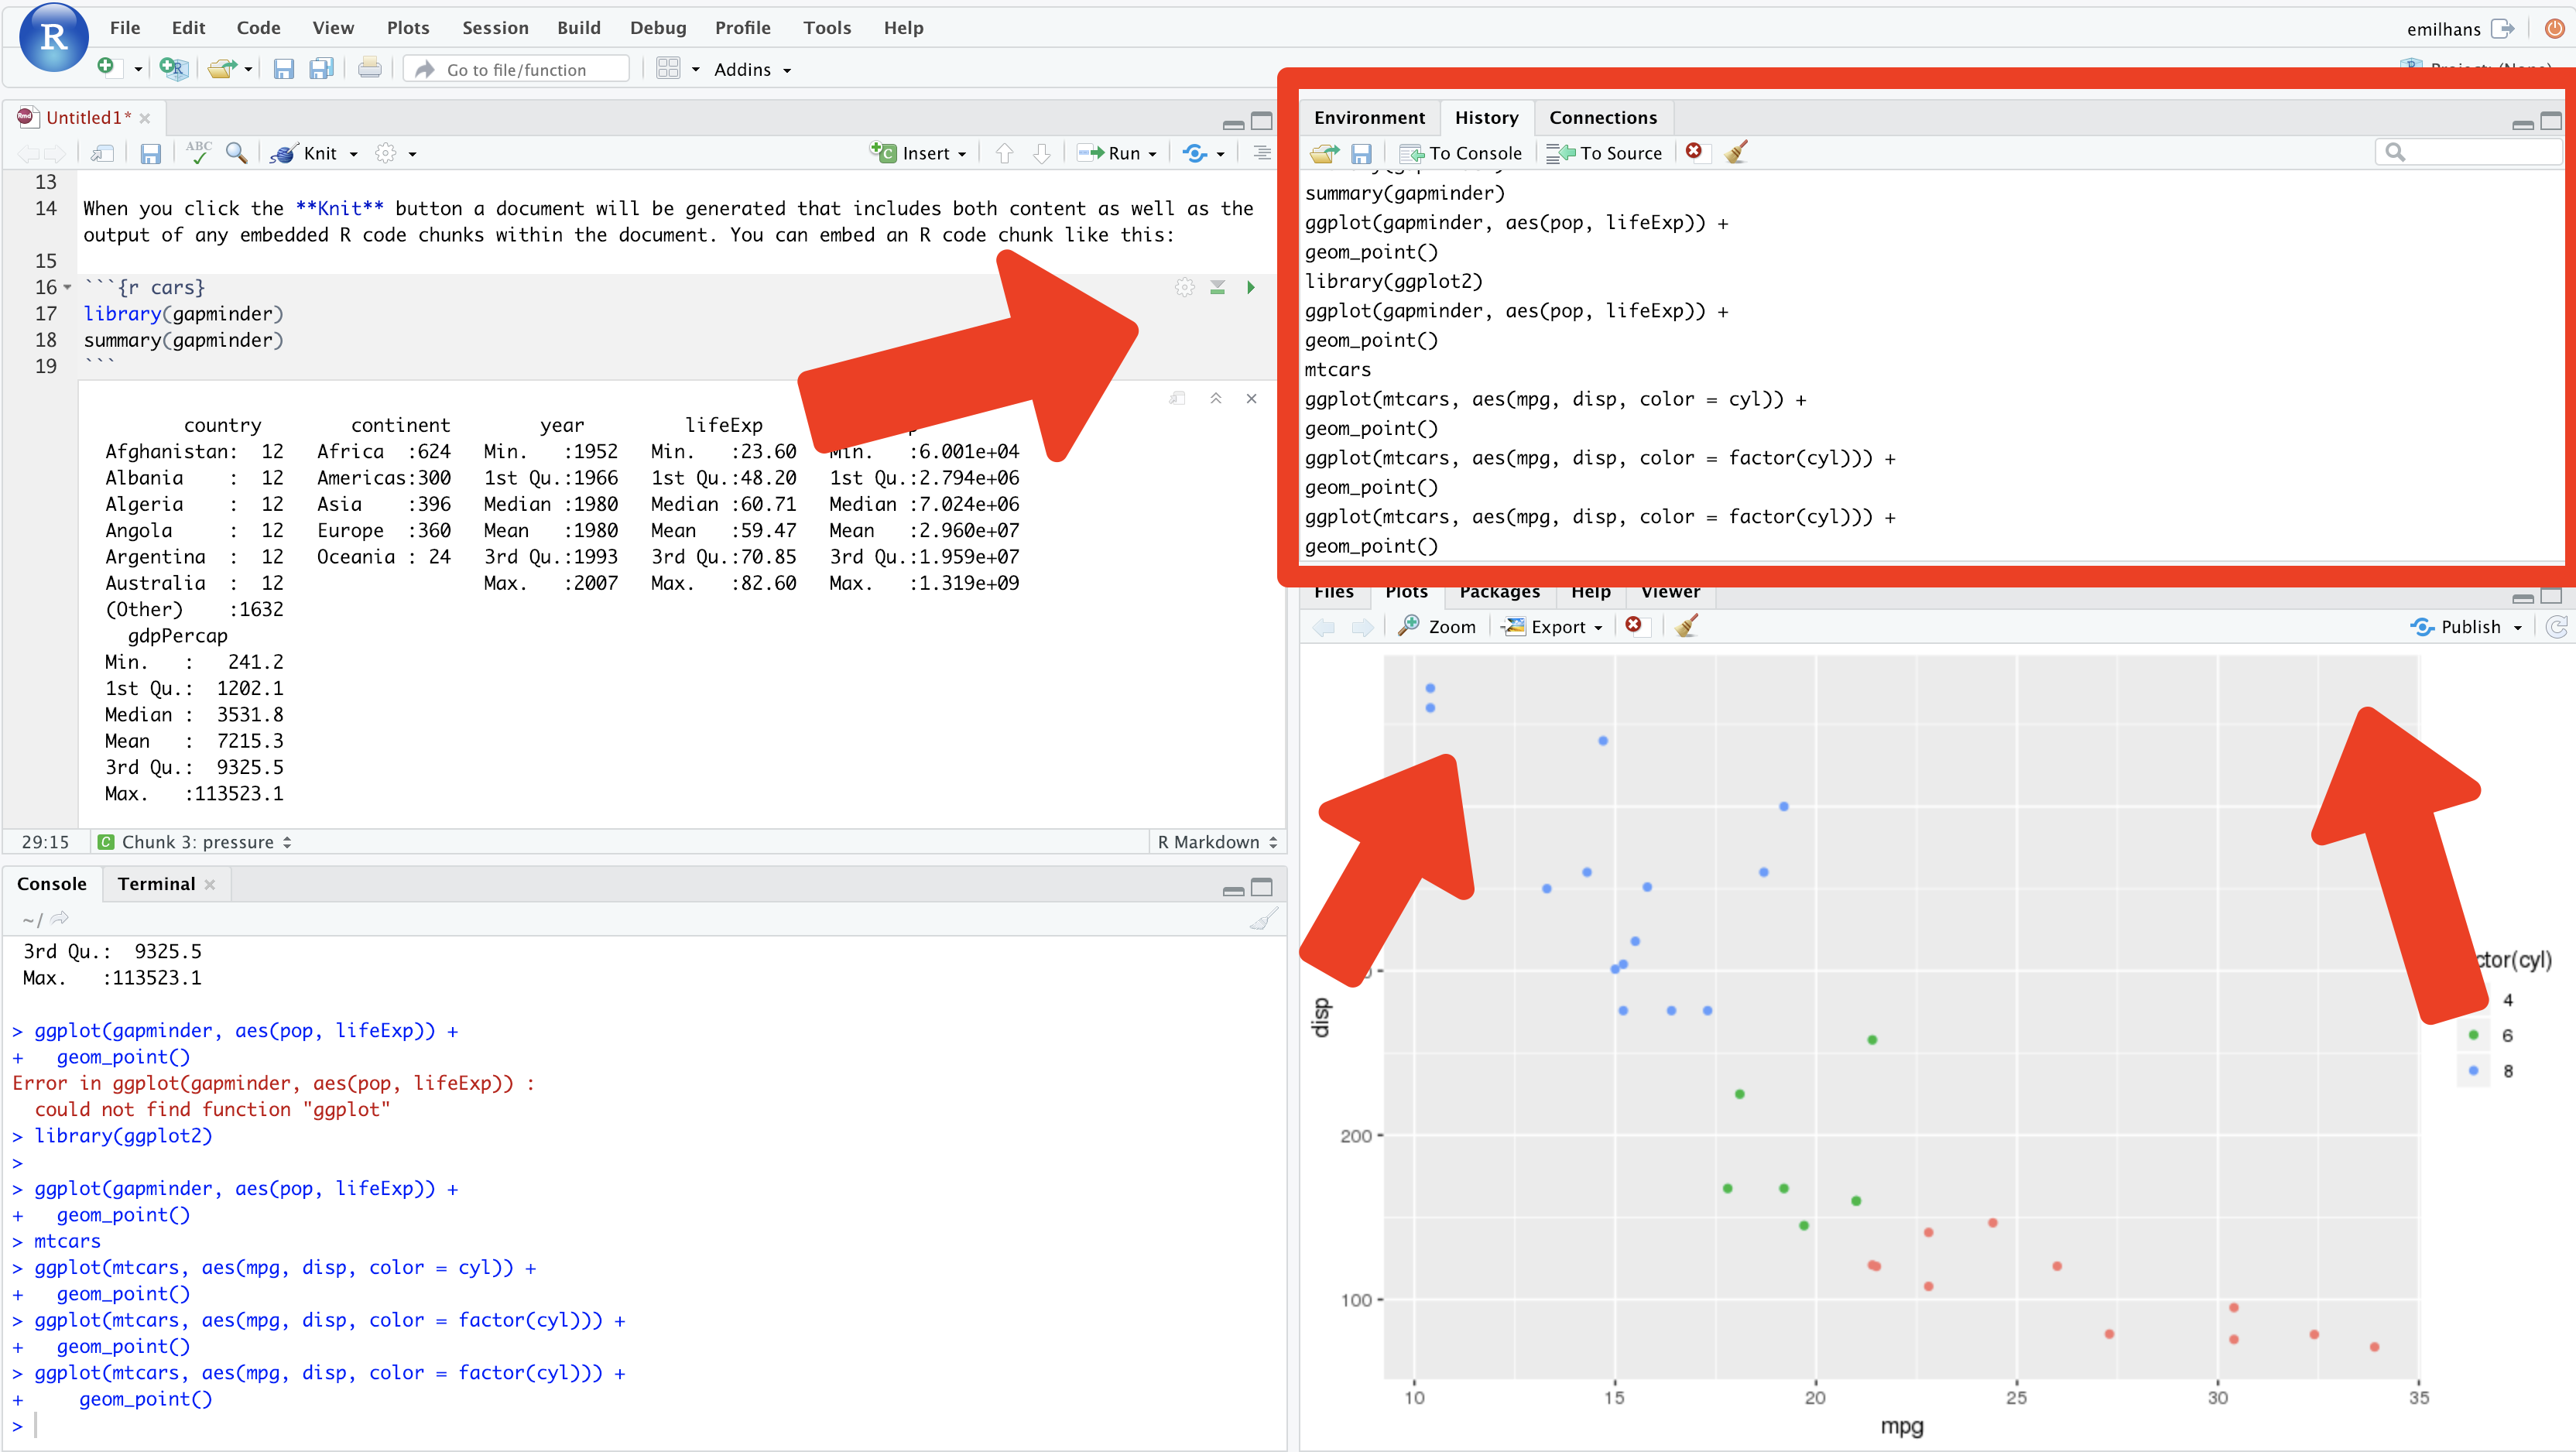 --- 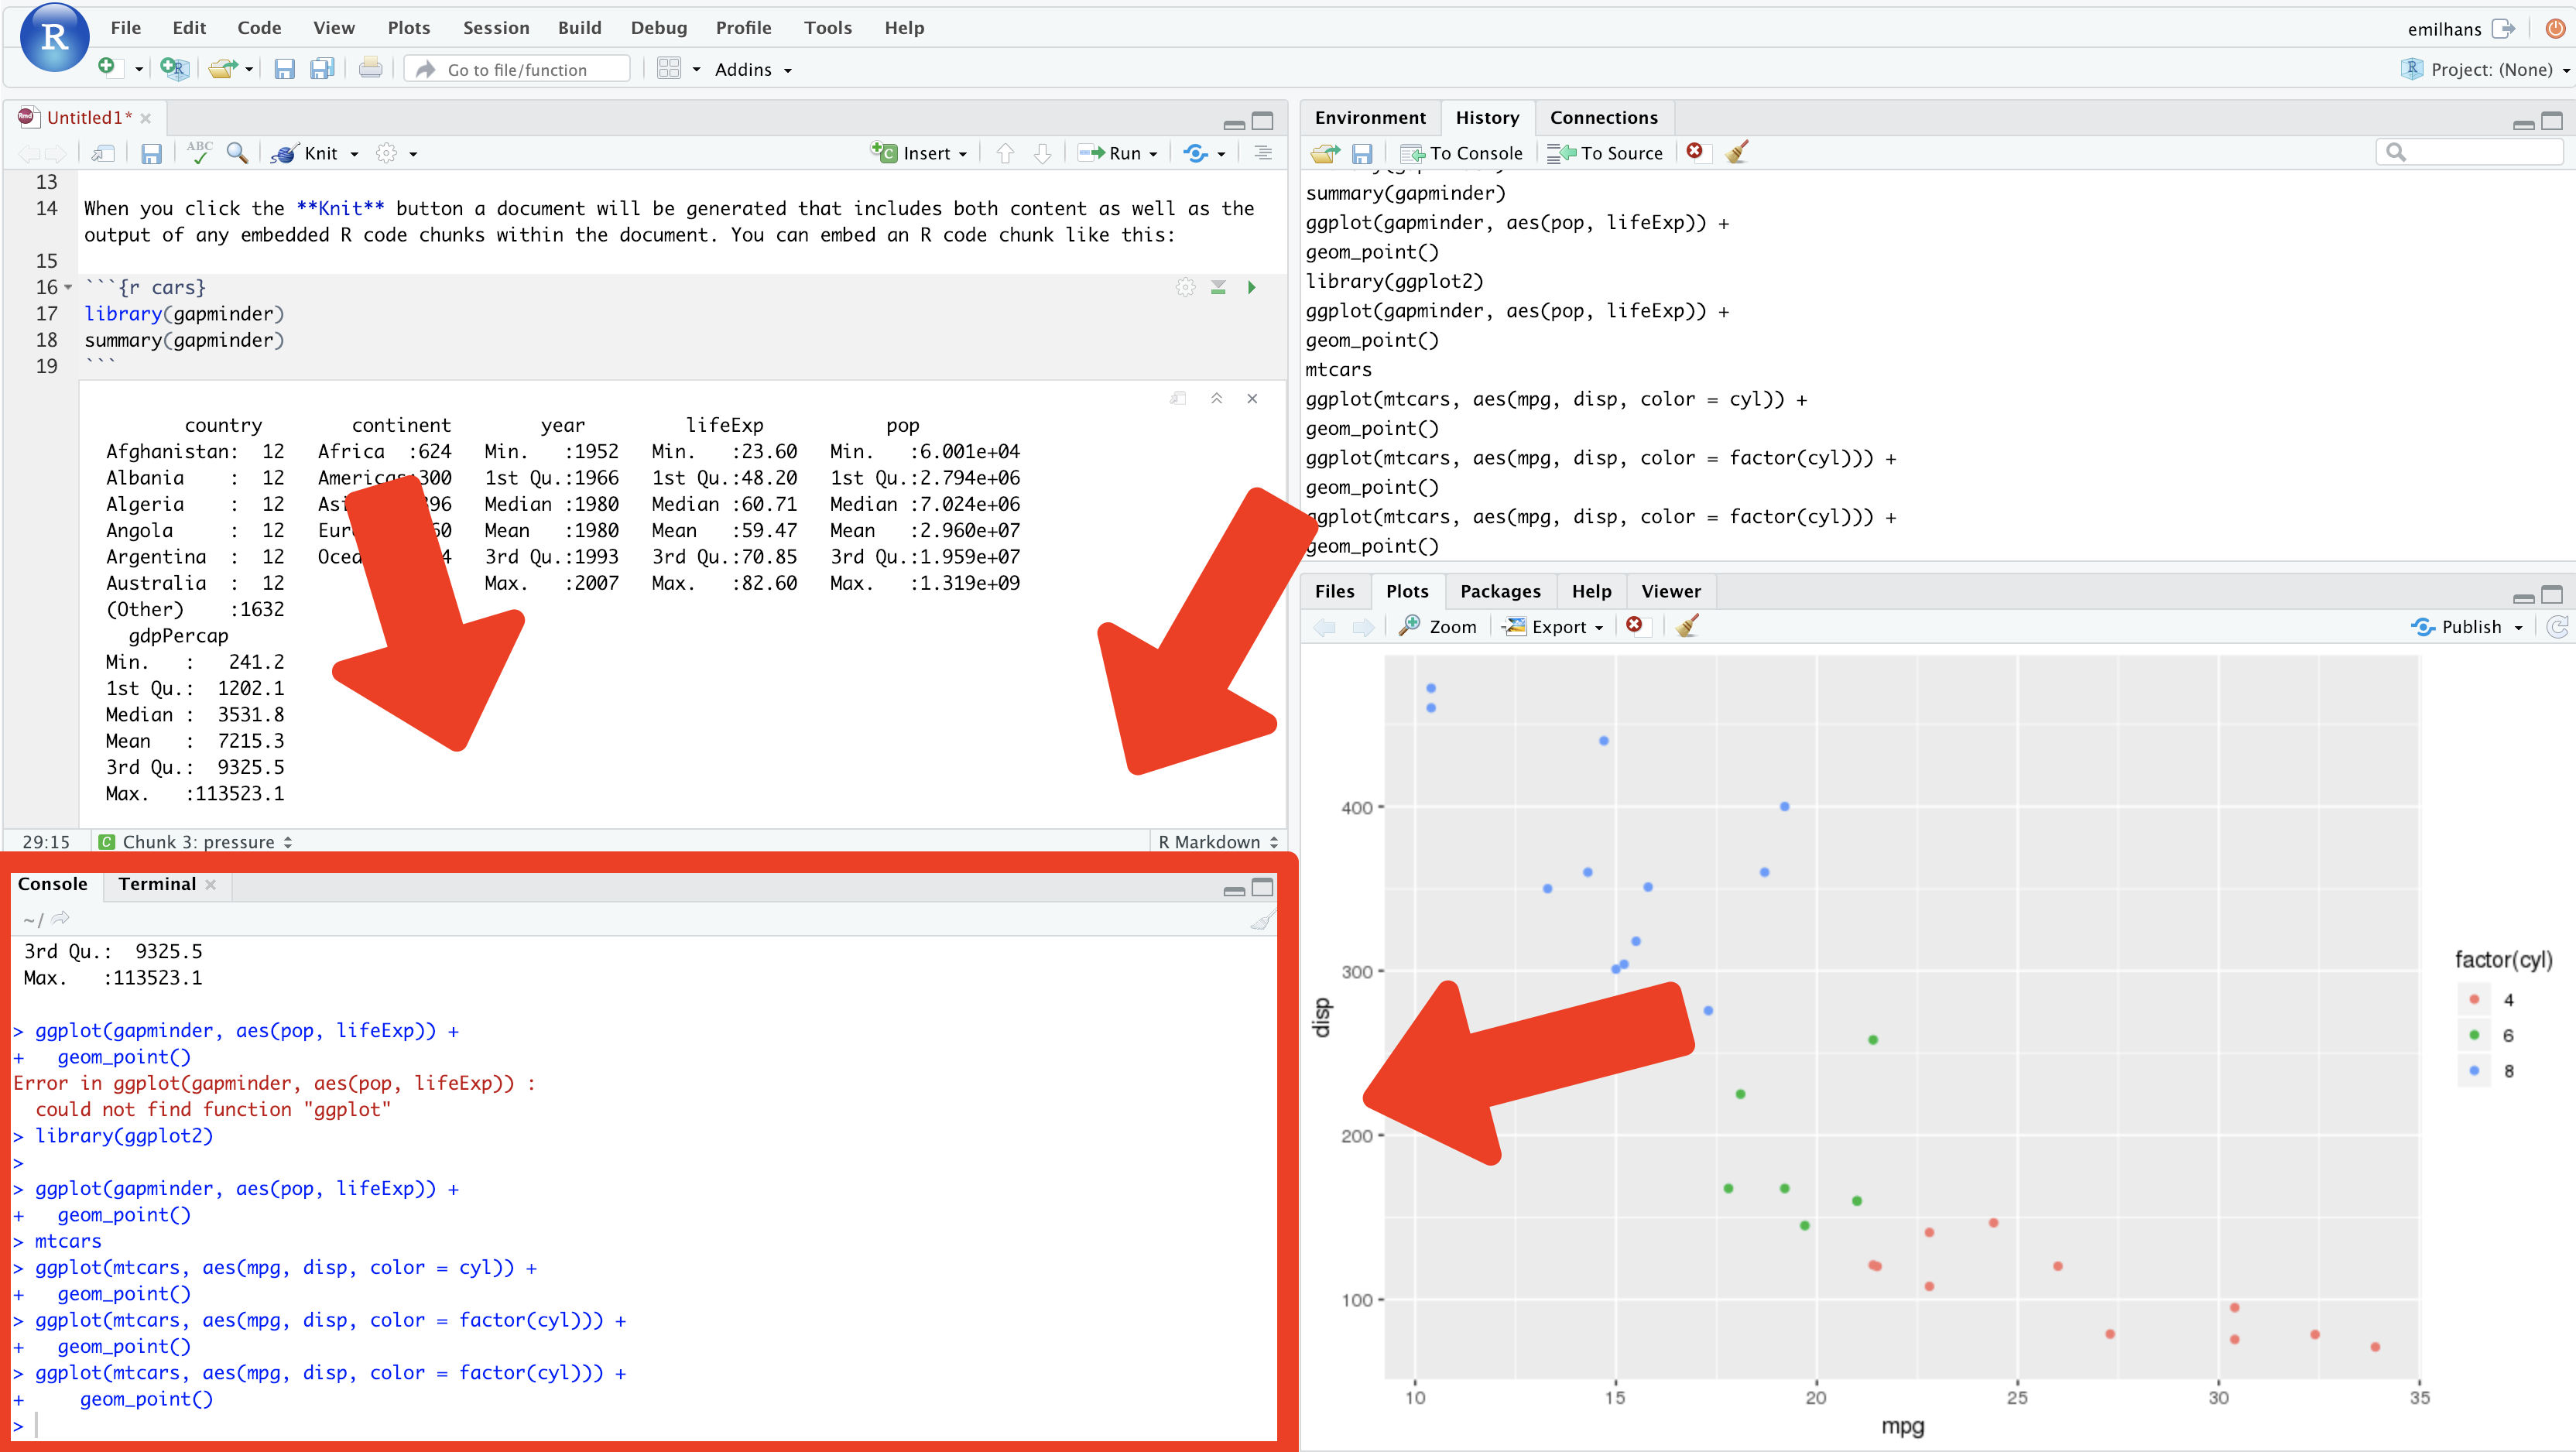 --- 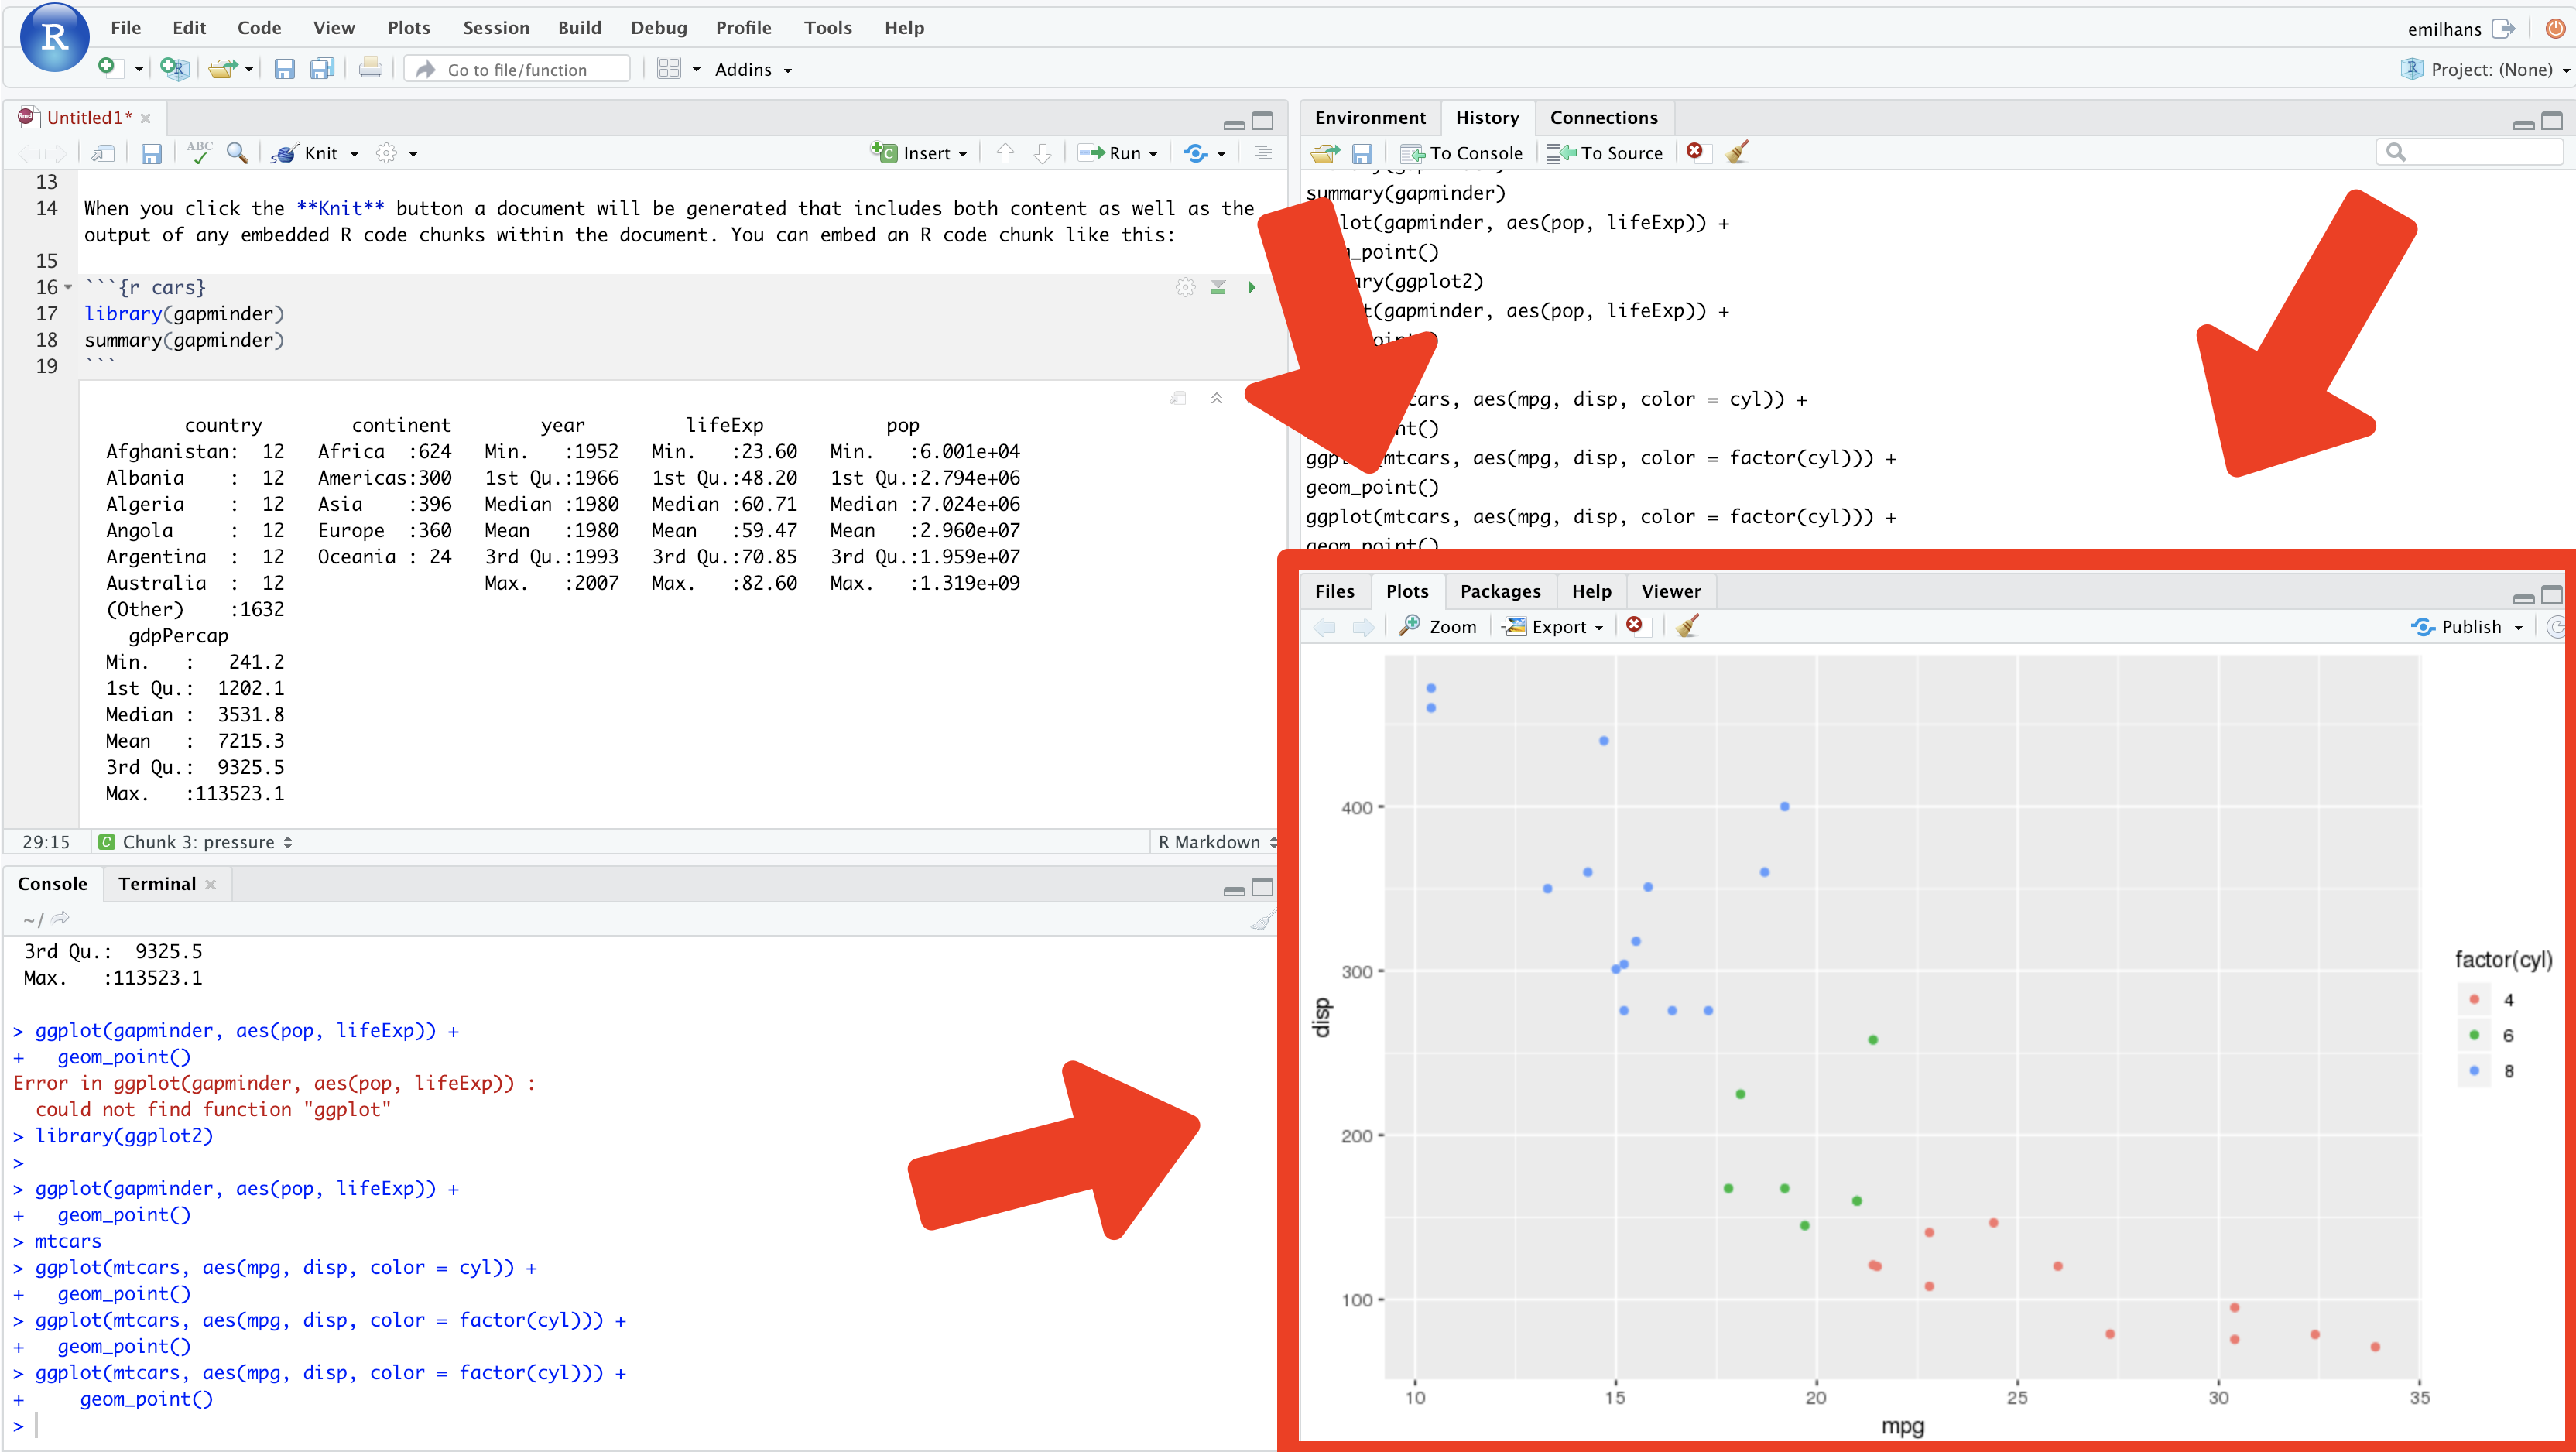 --- # Packages Idea -> Code -> Package -> Share -> Happiness If you want to do something, chance has it someone have worked on it before --- ## CRAN (The Comprehensive R Archive Network) 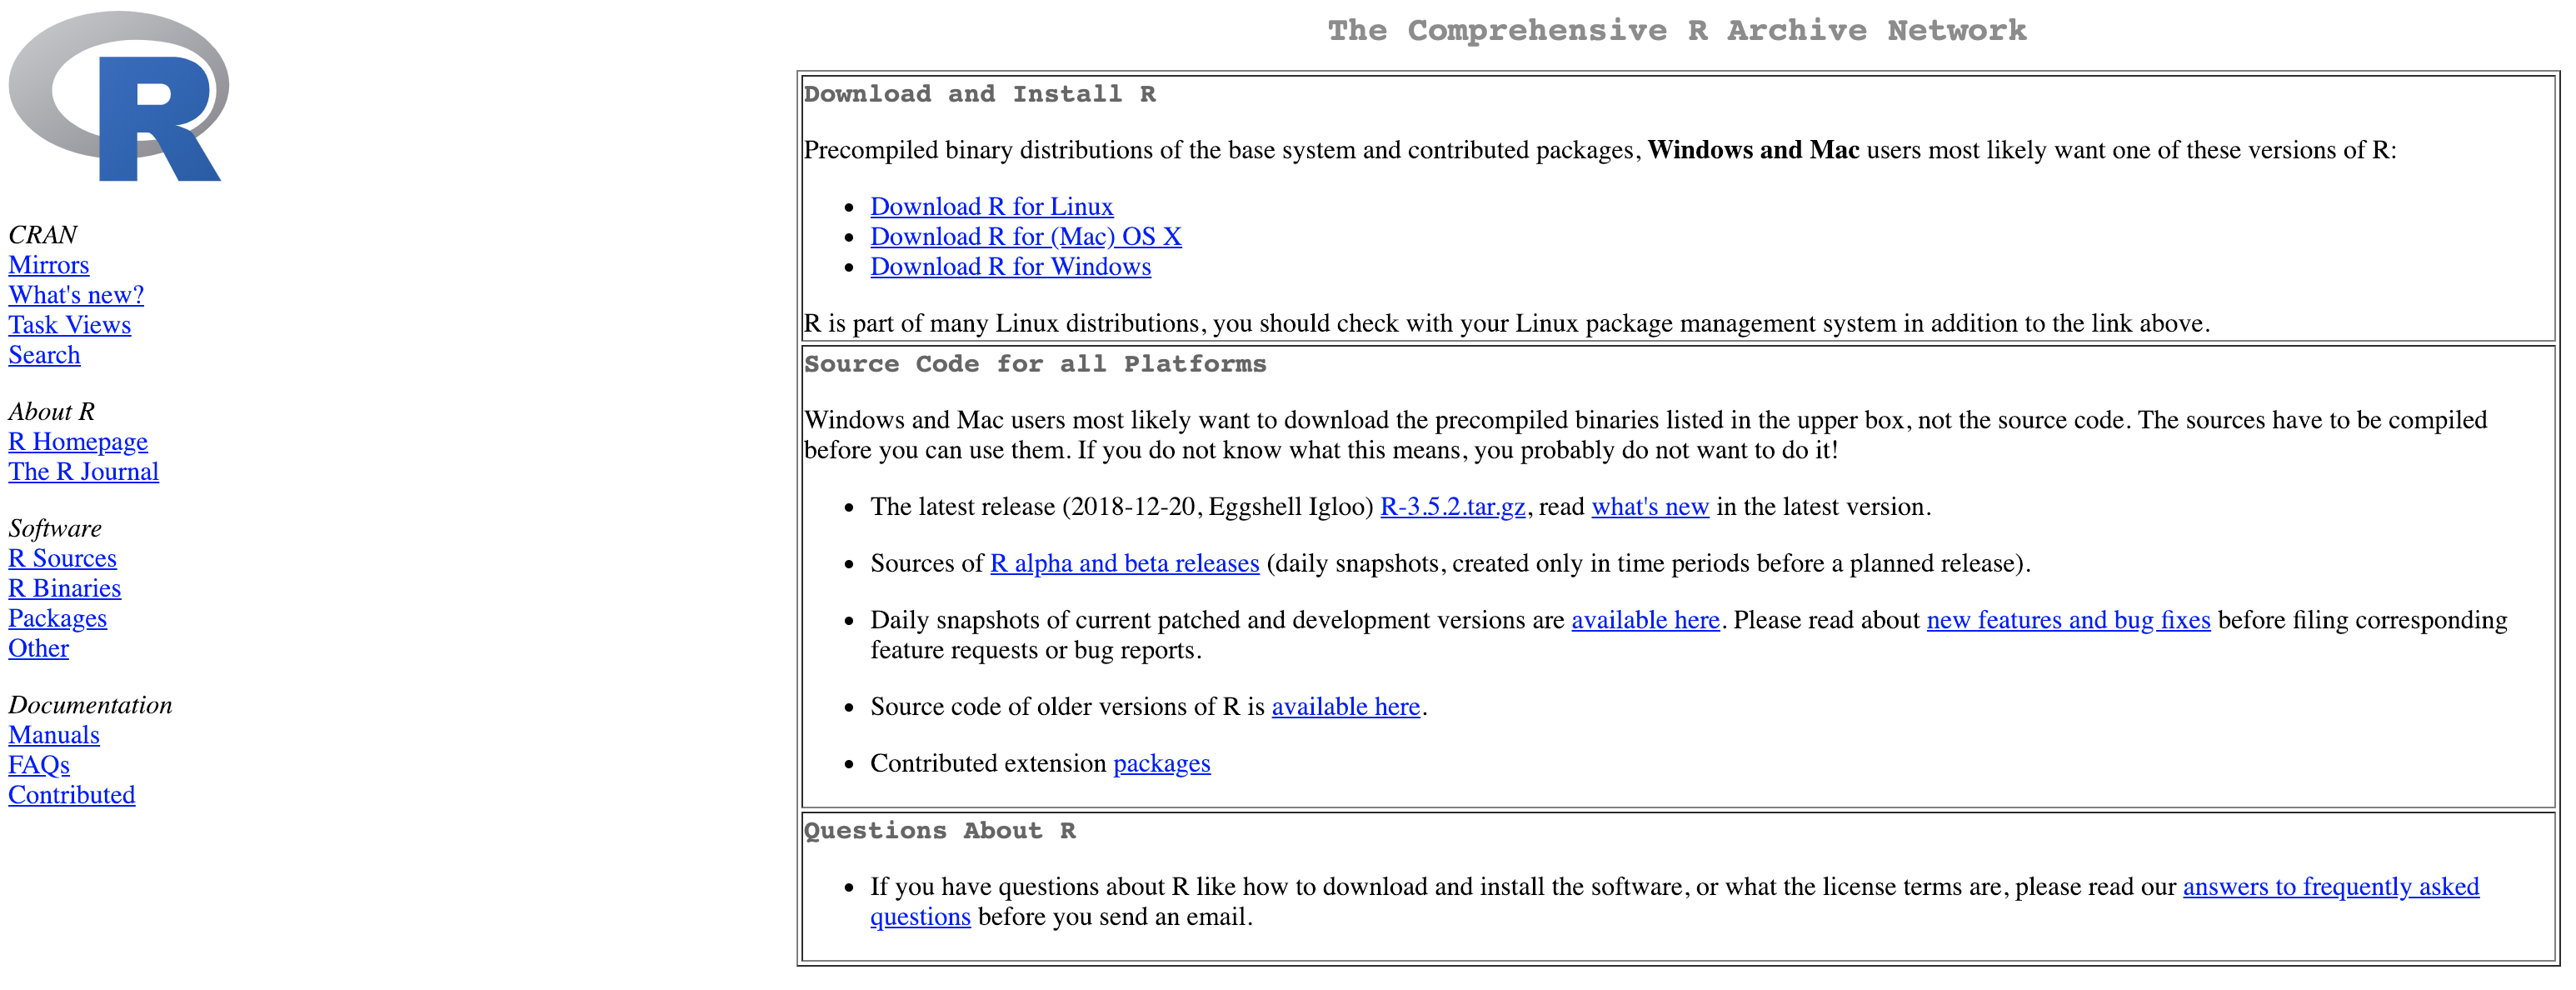 .center[https://cran.r-project.org/] --- .center[https://cran.r-project.org/web/packages/available_packages_by_name.html] 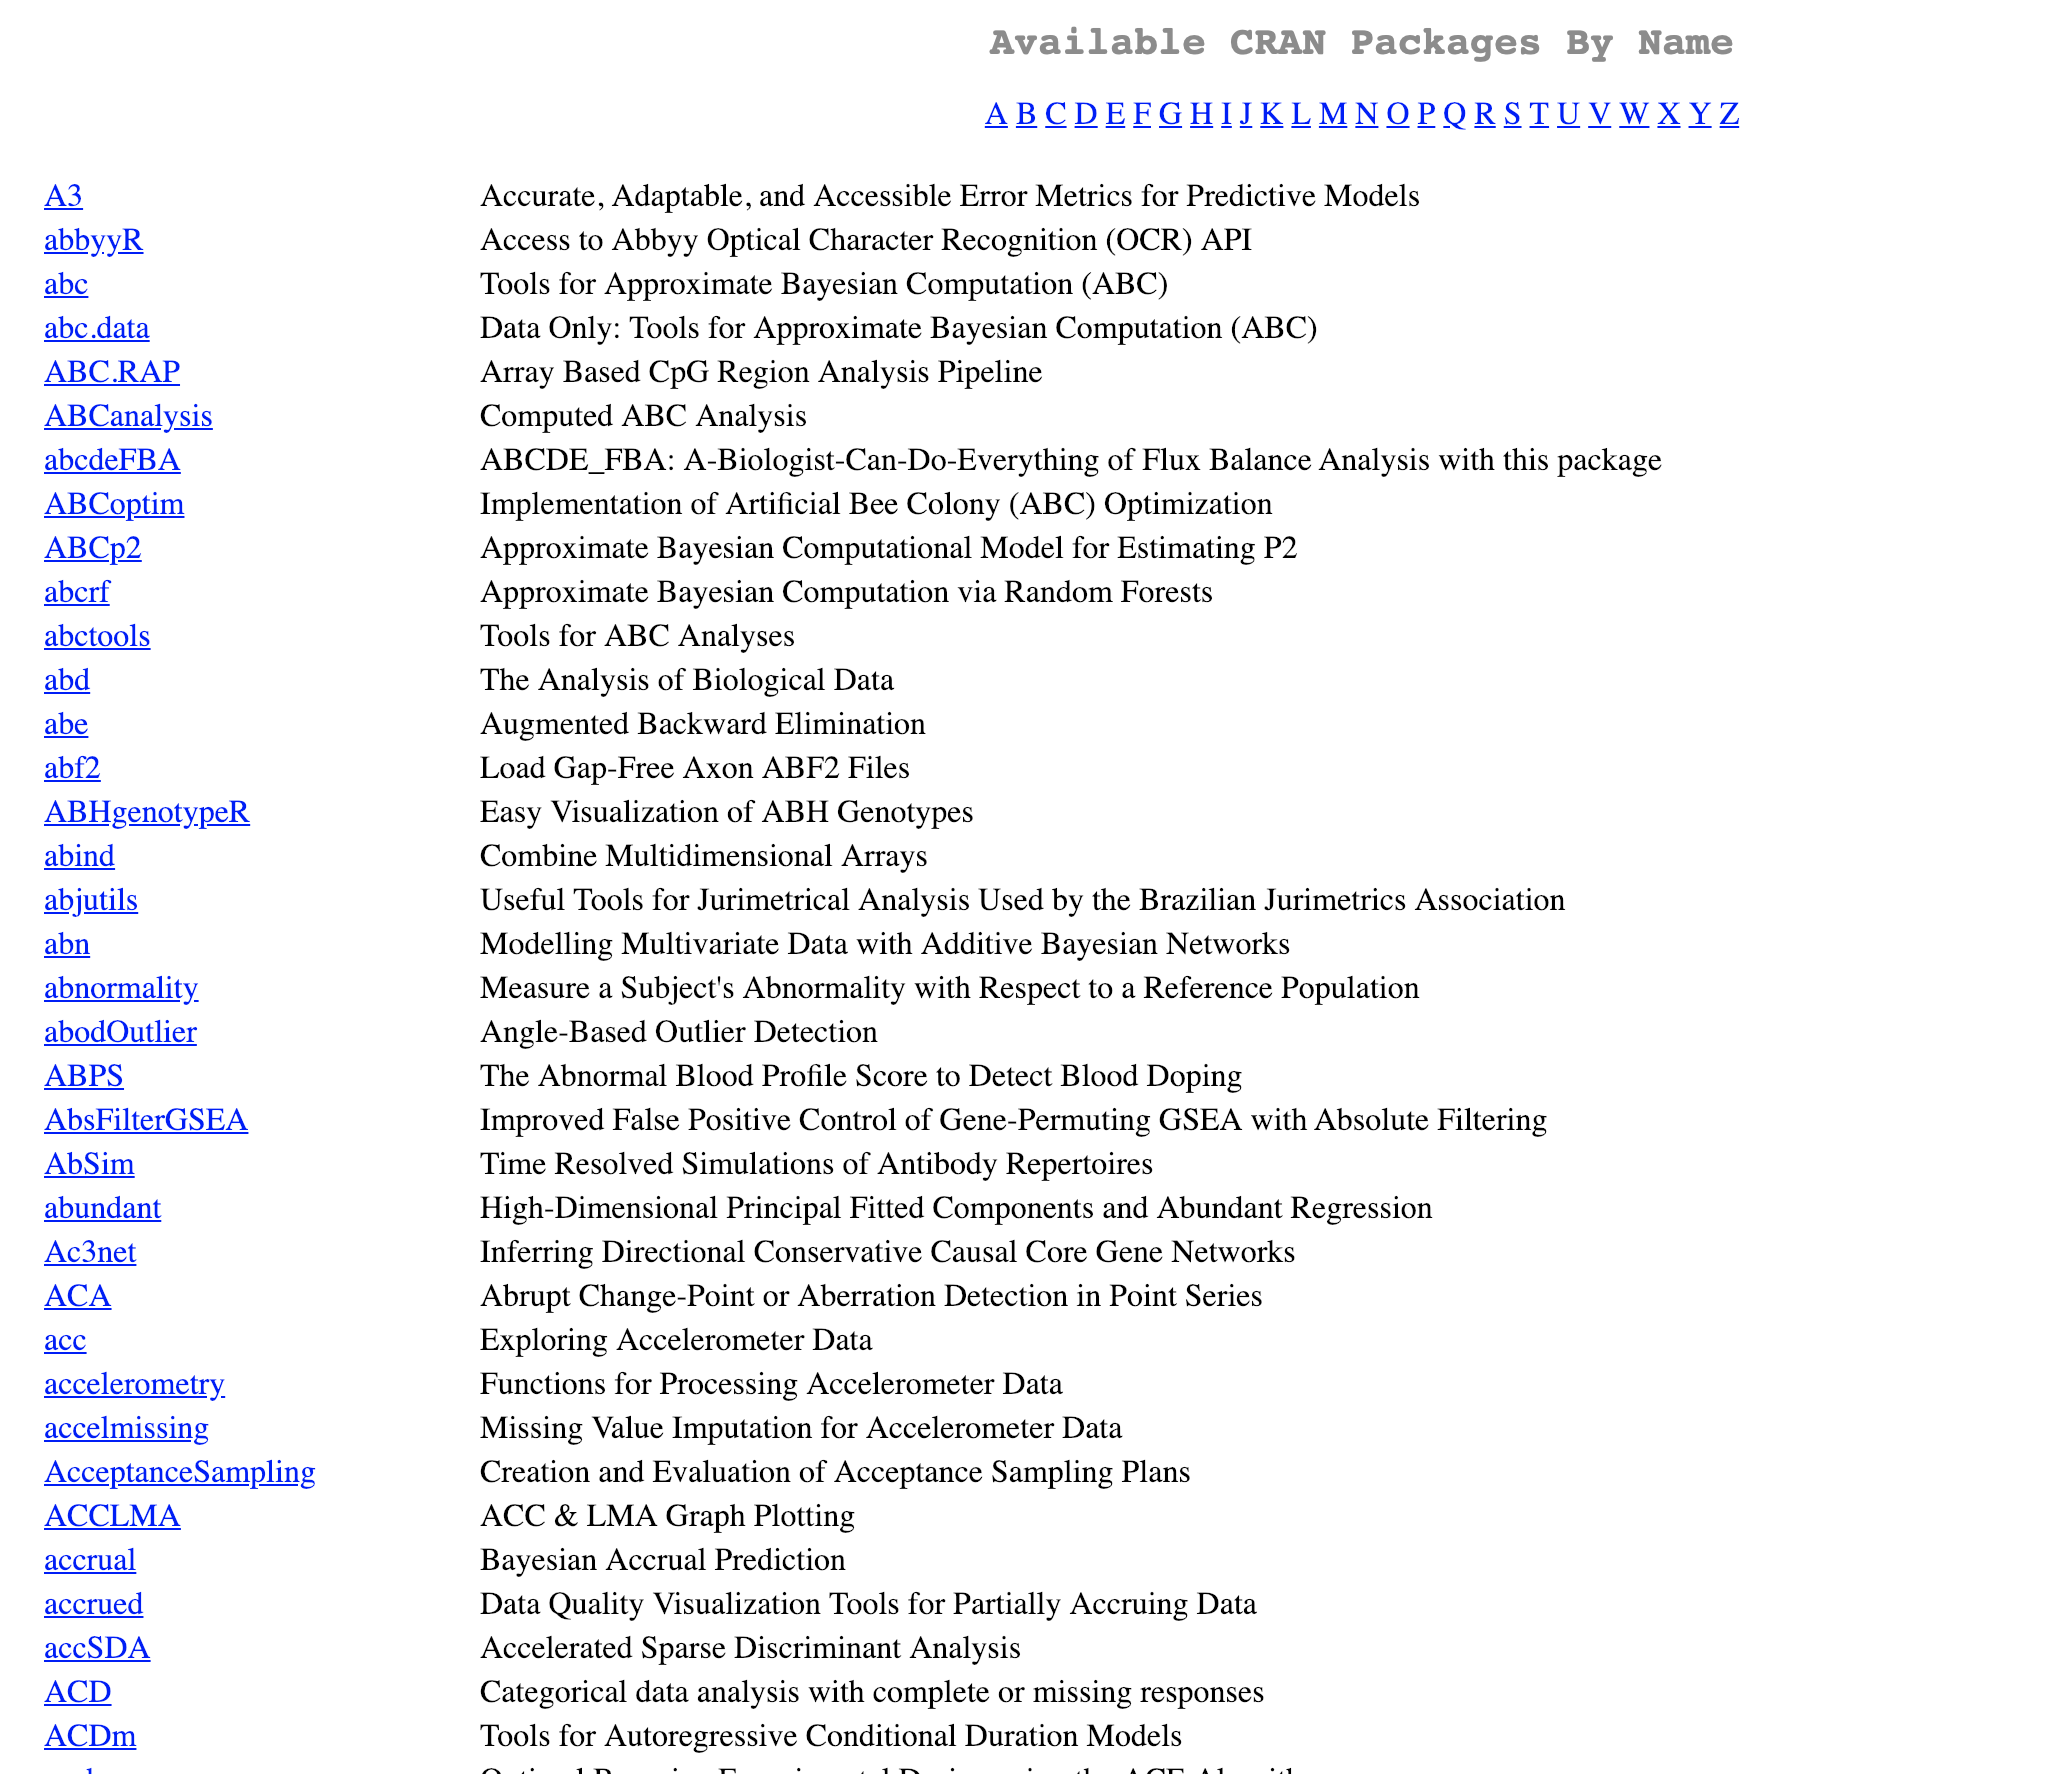 --- .center[https://cran.r-project.org/web/views/] 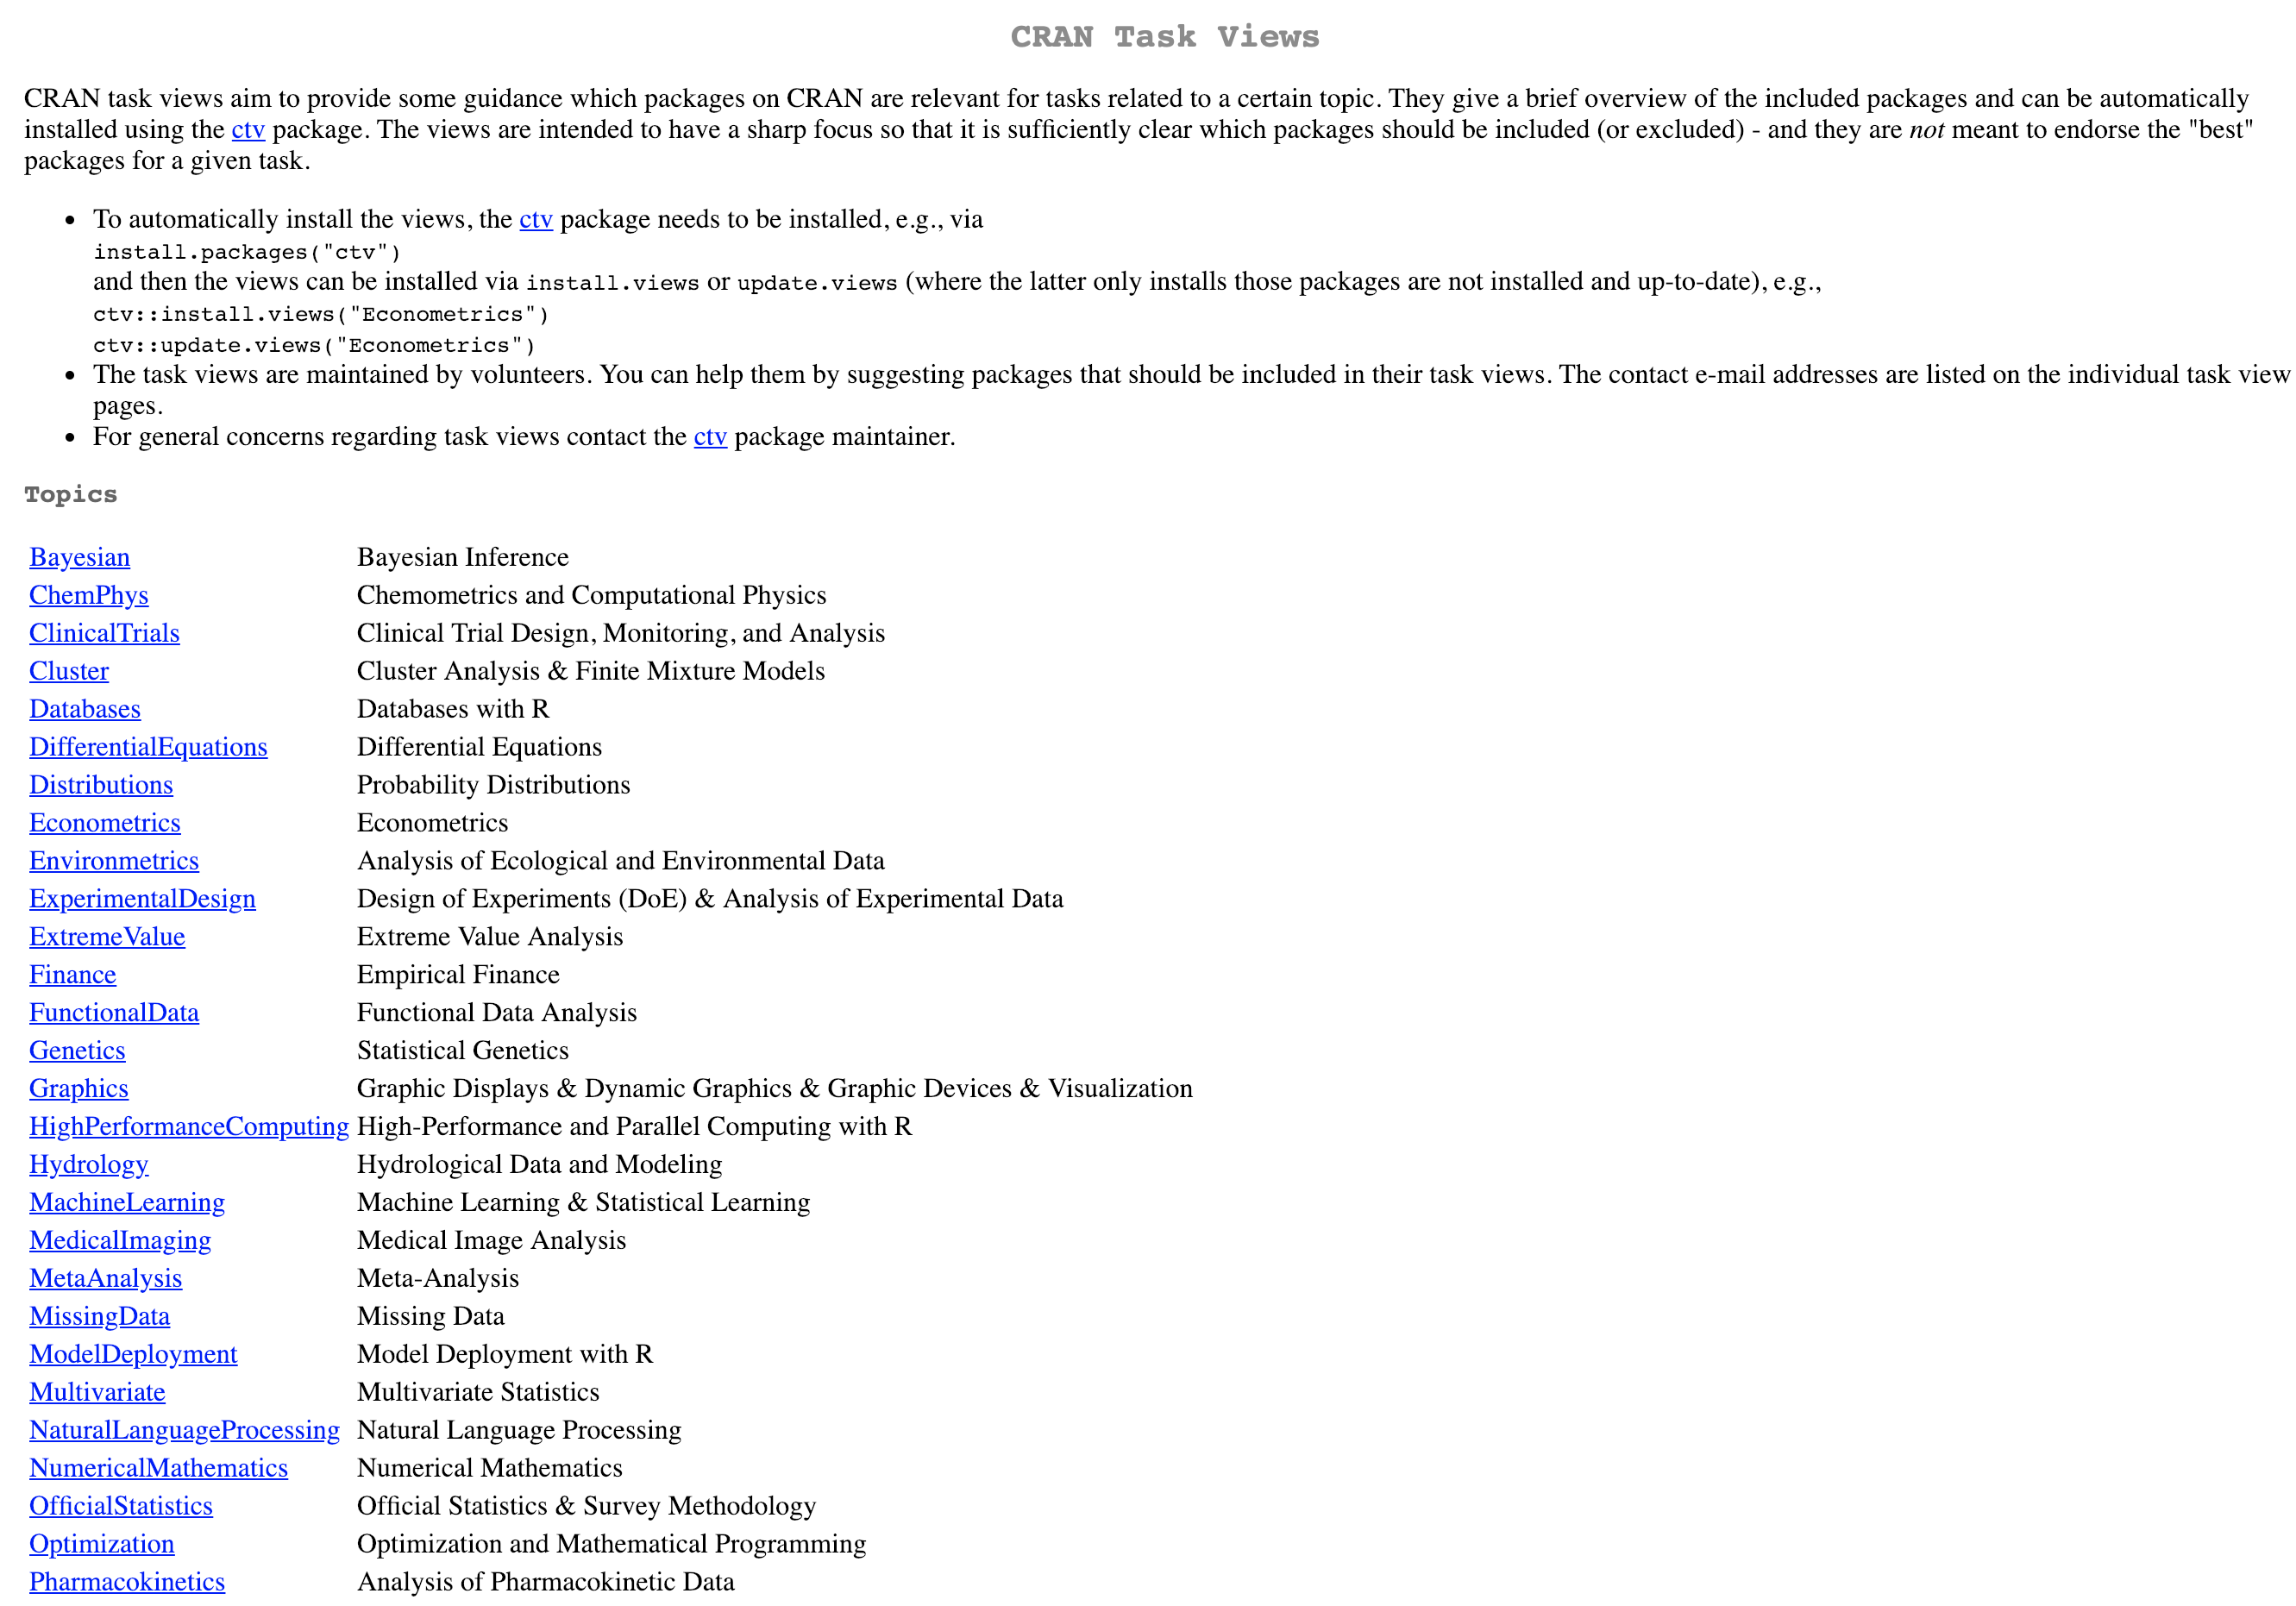 --- .center[https://www.bioconductor.org/]  --- .center[https://www.bioconductor.org/packages/release/BiocViews.html#___Software] 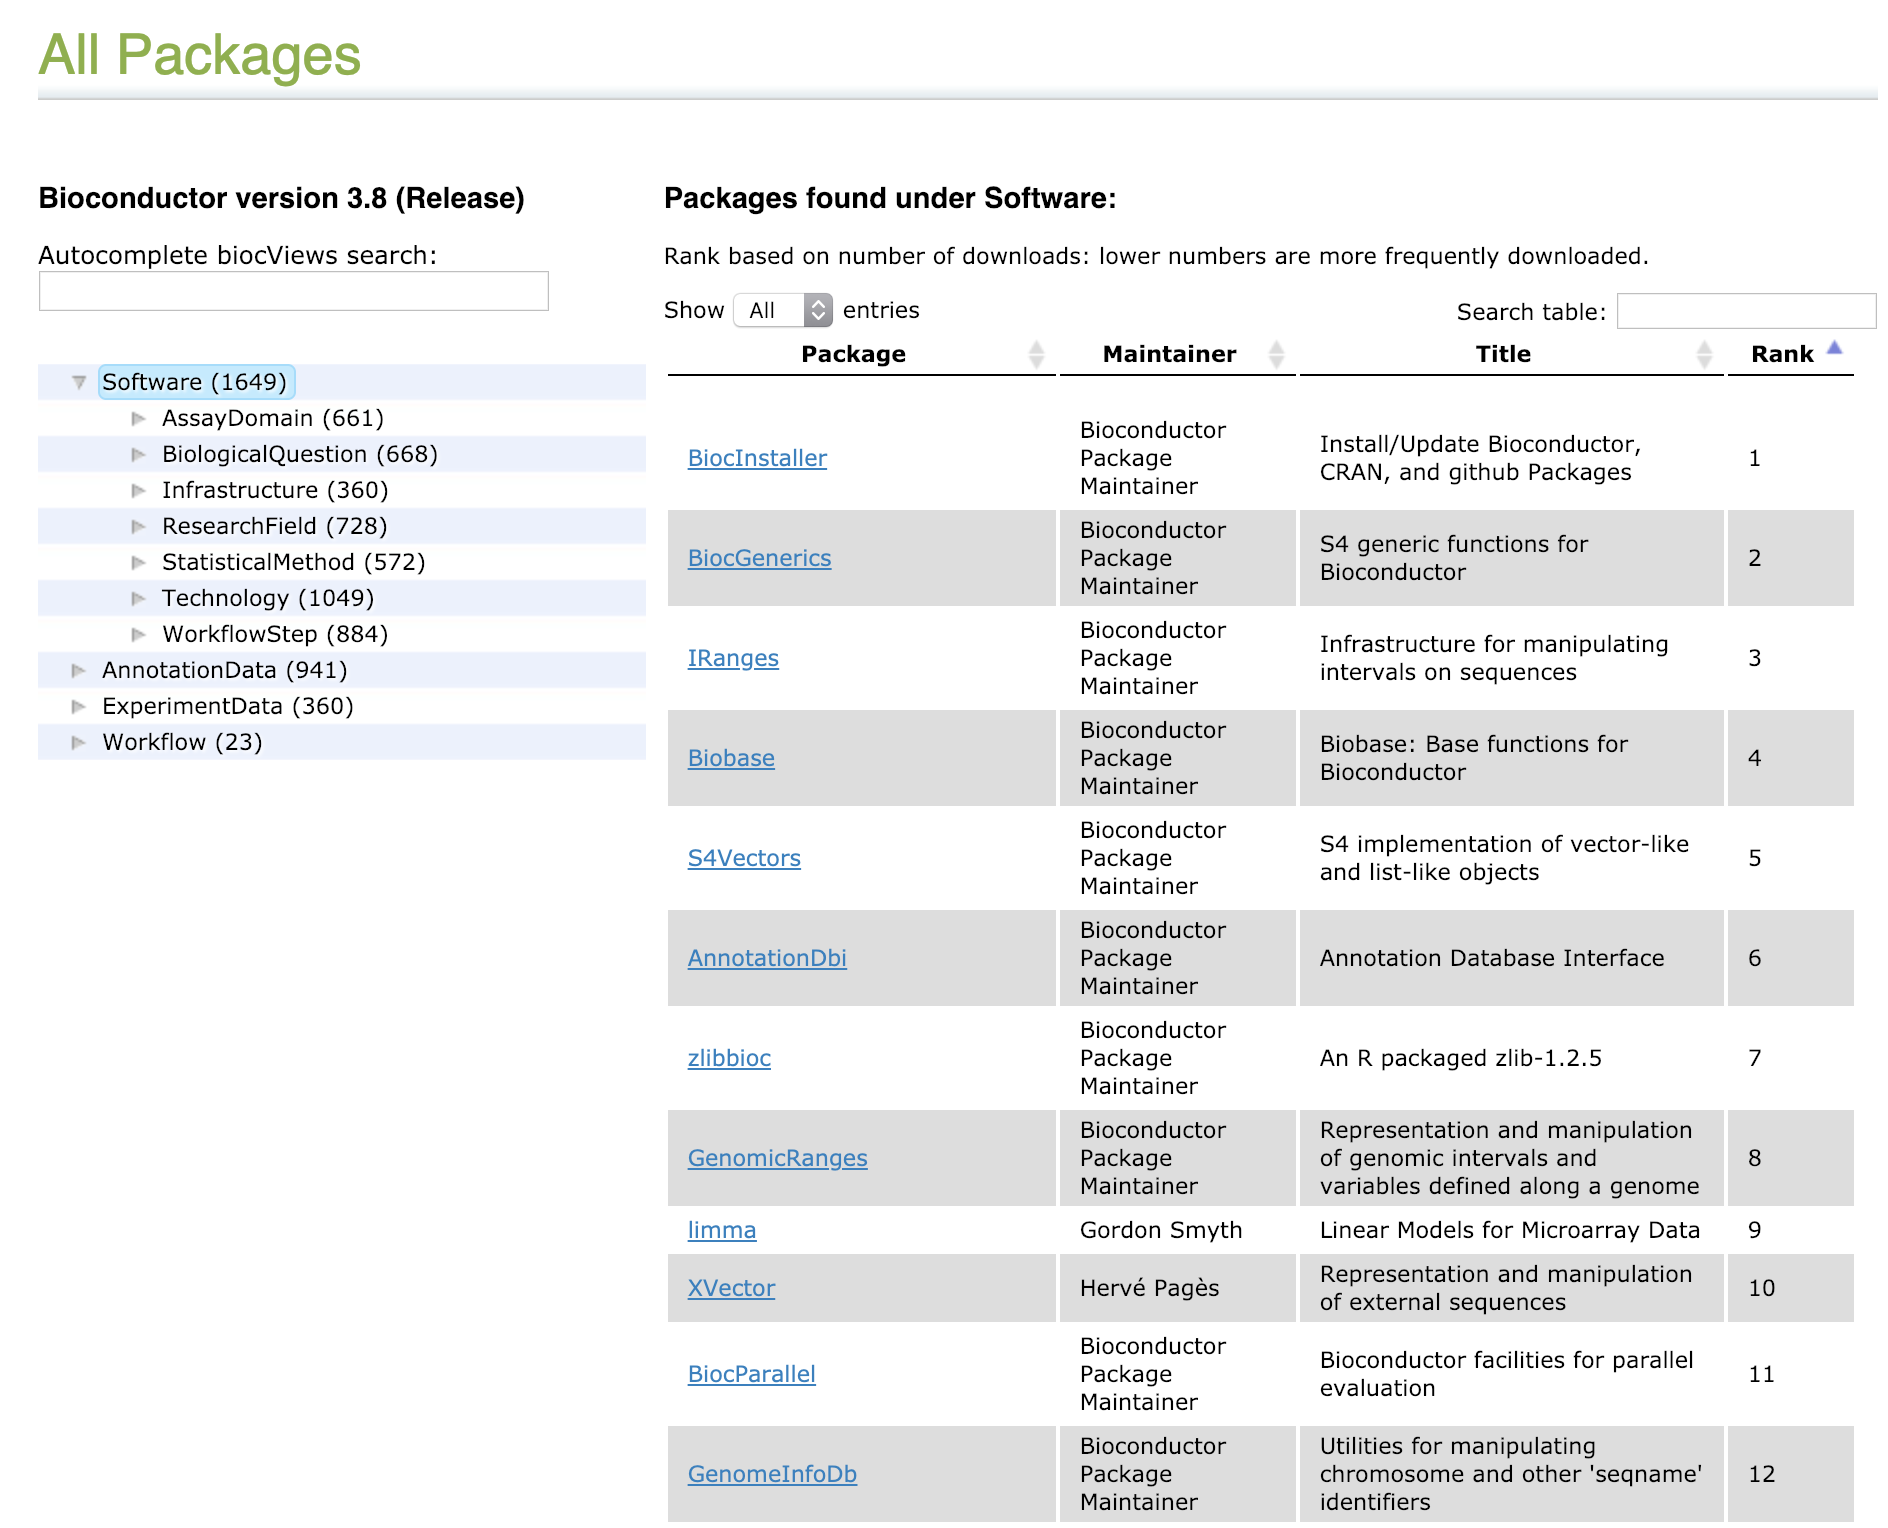 --- # R Markdown <img src='https://raw.githubusercontent.com/rstudio/hex-stickers/master/PNG/rmarkdown.png' align="right" height="139" /> - Compile a single R Markdown document to a report in different formats, such as PDF, HTML, or Word. - Make slides for presentations (HTML5, LaTeX Beamer, or PowerPoint). - Build interactive applications based on Shiny. - Write journal articles. - Much more. --- # Creating a R Markdown file .center[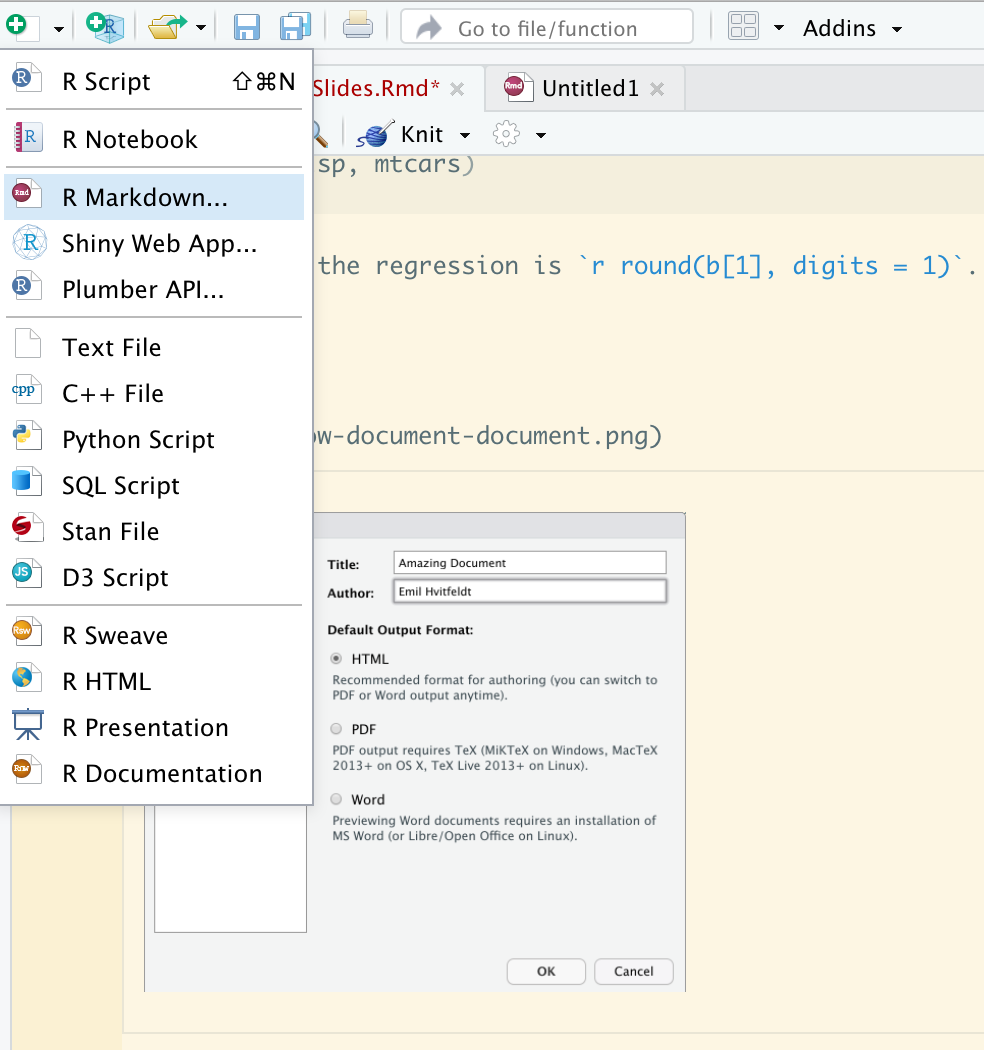] --- # Creating a R Markdown file .center[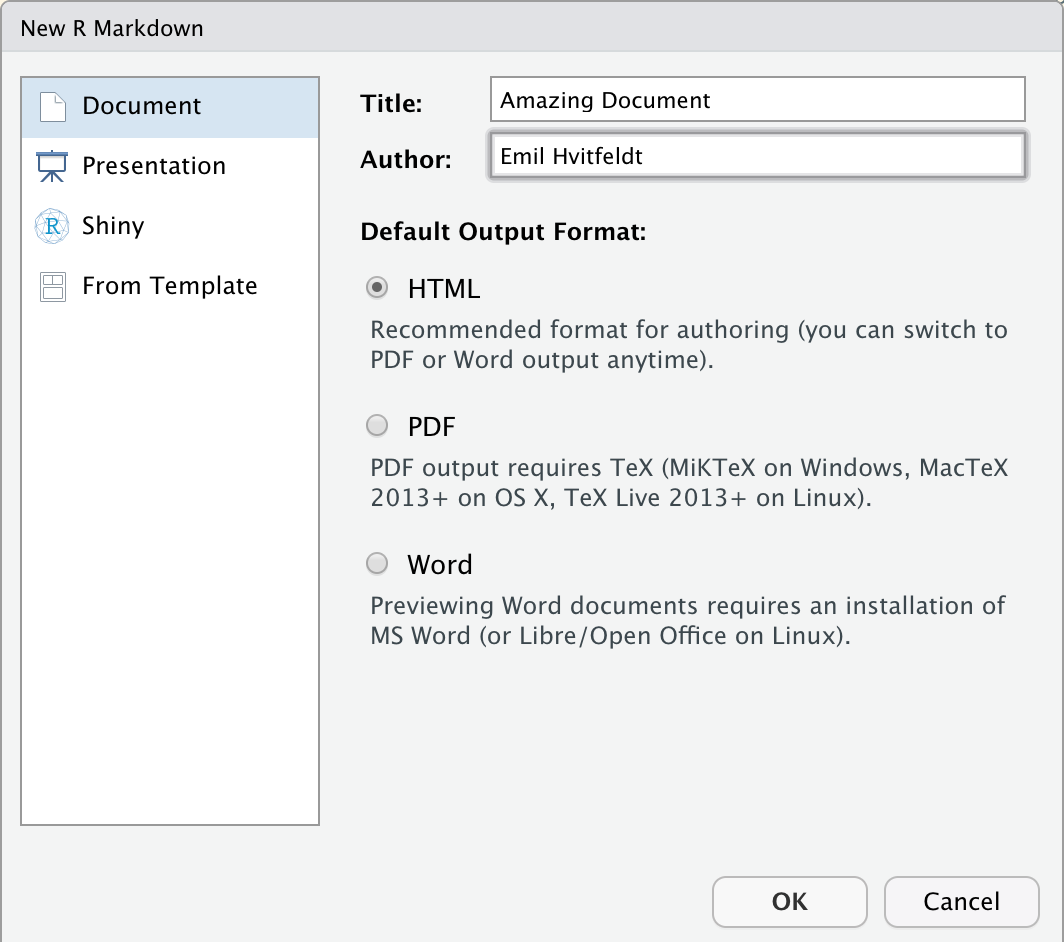] --- # Creating a R Markdown file .center[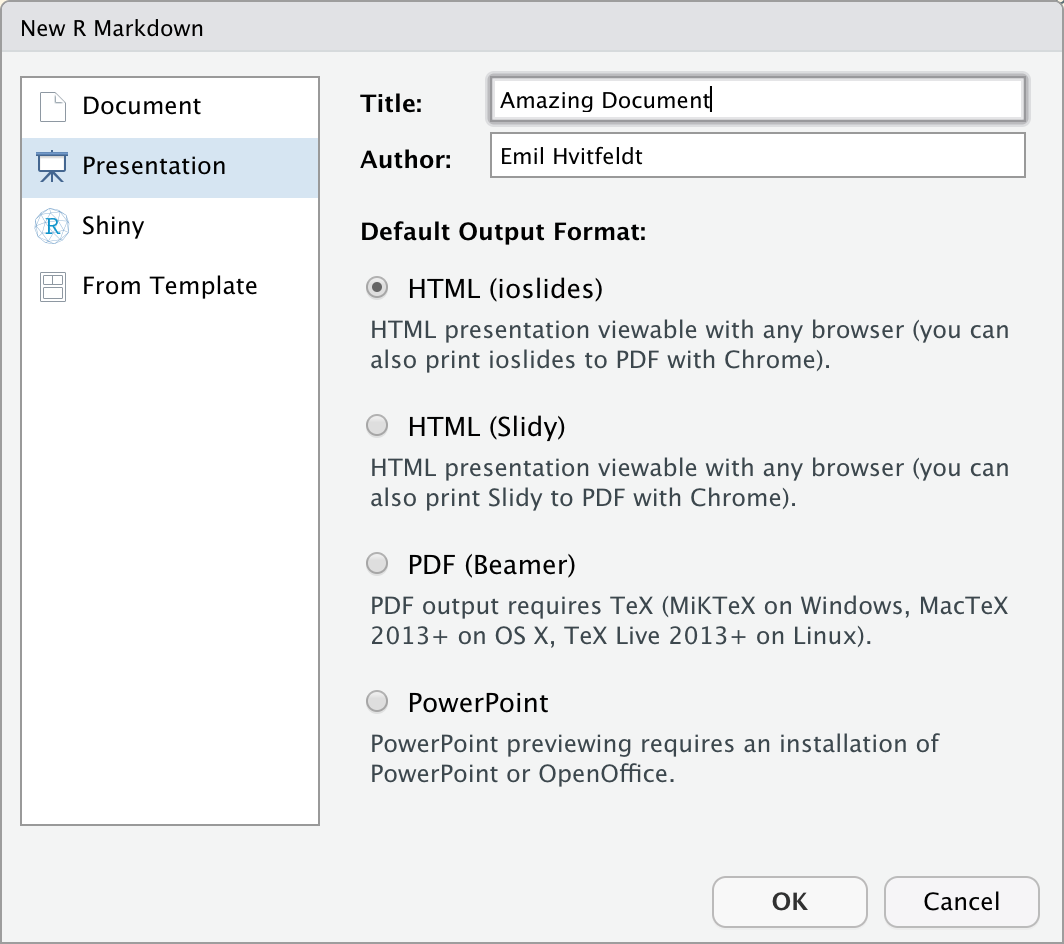] --- # Creating a R Markdown file .center[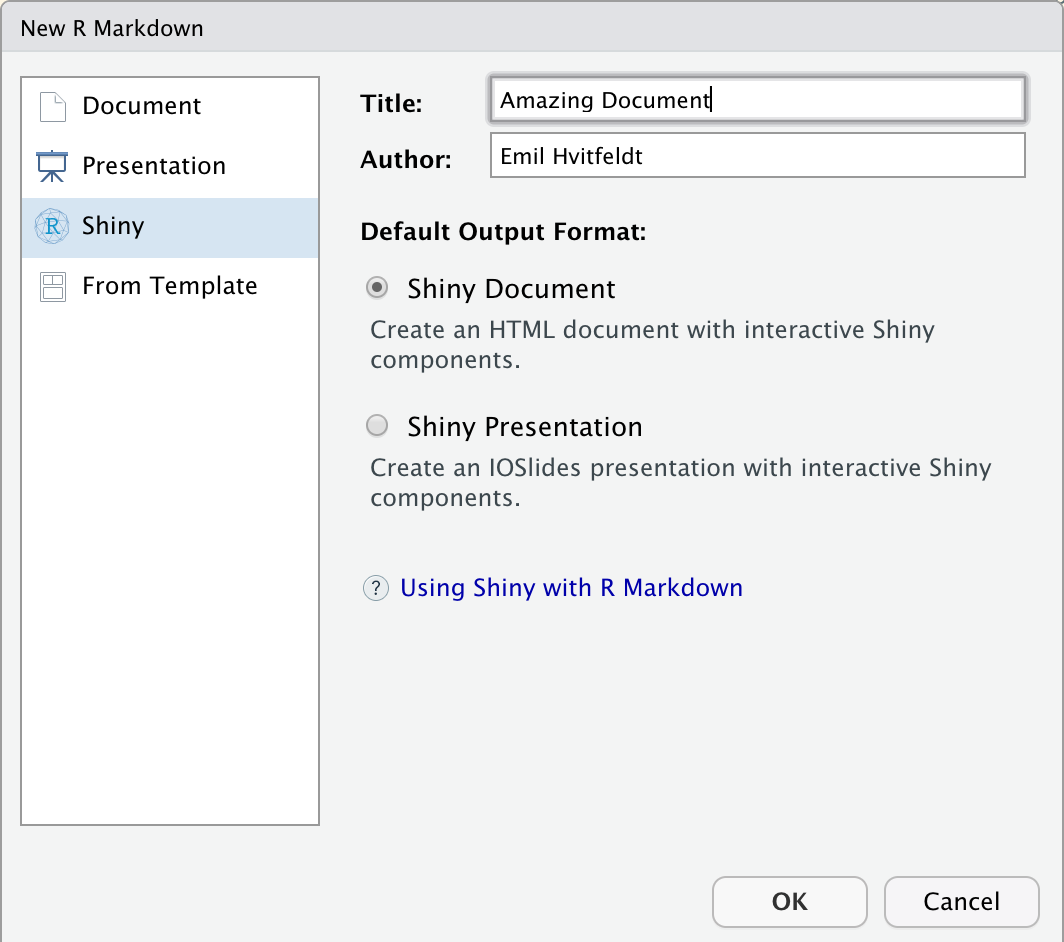] --- # Creating a R Markdown file .center[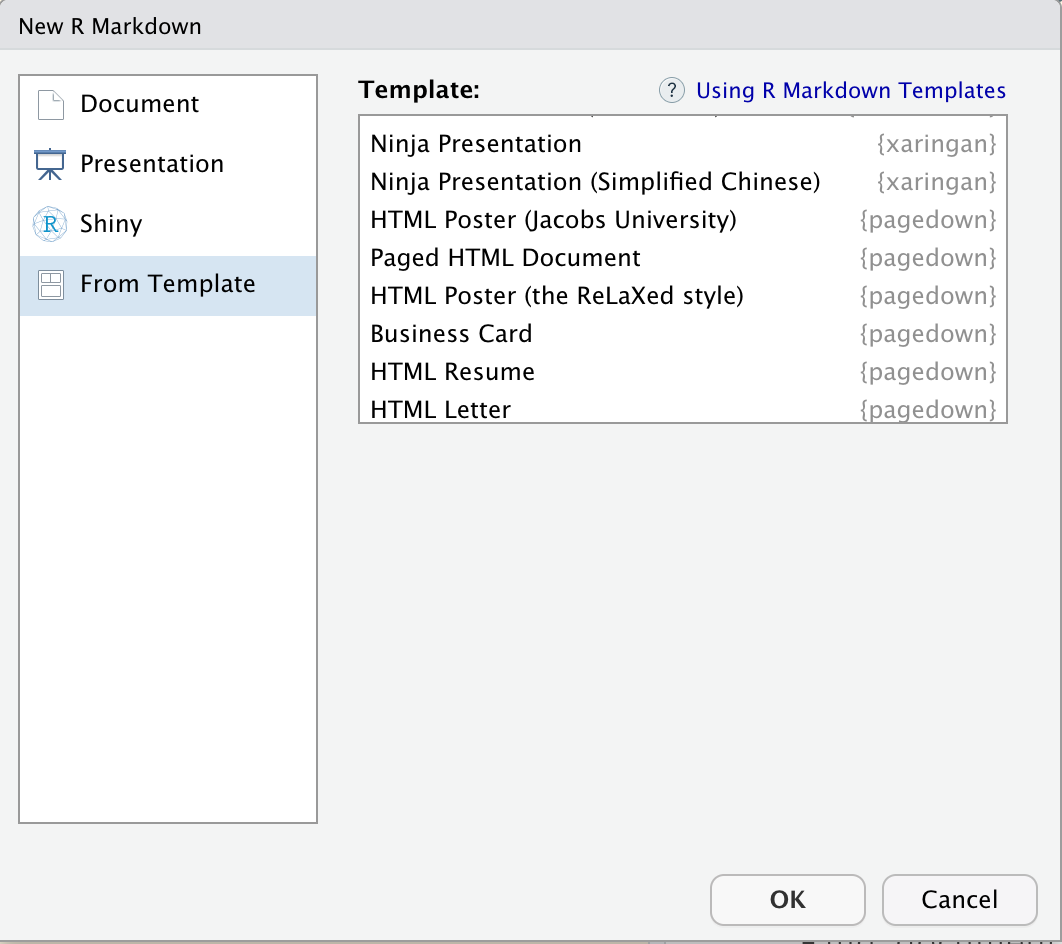] --- .pull-left[ ``` --- title: "Amazing Document" author: "Emil Hvitfeldt" date: "1/20/2019" output: html_document --- ``` ] .pull-right[ ### YAML (optional) ] --- .pull-left[ ``` --- title: "Amazing Document" author: "Emil Hvitfeldt" date: "1/20/2019" output: html_document --- ``` ] .pull-right[ ### YAML: YAML Ain't Markup Language ] --- .pull-left[ ``` --- title: "Amazing Document" author: "Emil Hvitfeldt" date: "1/20/2019" output: html_document --- ``` <br> **Chunks** of code surrounded by ` ``` ` ] .pull-right[ ### YAML (optional) <br><br> ### The R in R Markdown ] --- .pull-left[ ``` --- title: "Amazing Document" author: "Emil Hvitfeldt" date: "1/20/2019" output: html_document --- ``` <br> **Chunks** of code surrounded by ` ``` ` <br> Text with simple text formating. ] .pull-right[ ### YAML (optional) <br><br> ### The R in R Markdown <br> ### The Markdown in R Markdown ] --- .pull-left[ **What we write** ```` --- author: "Emil Hvitfeldt" date: "1/20/2019" output: html_document --- We built a **linear** regression model. ```{r} fit <- lm(mpg ~ disp, data = mtcars) b <- coef(fit) plot(mpg ~ disp, mtcars) ``` The slope of the regression is `r round(b[1], digits = 1)` in the output. ```` ] -- .pull-right[ **What we get** 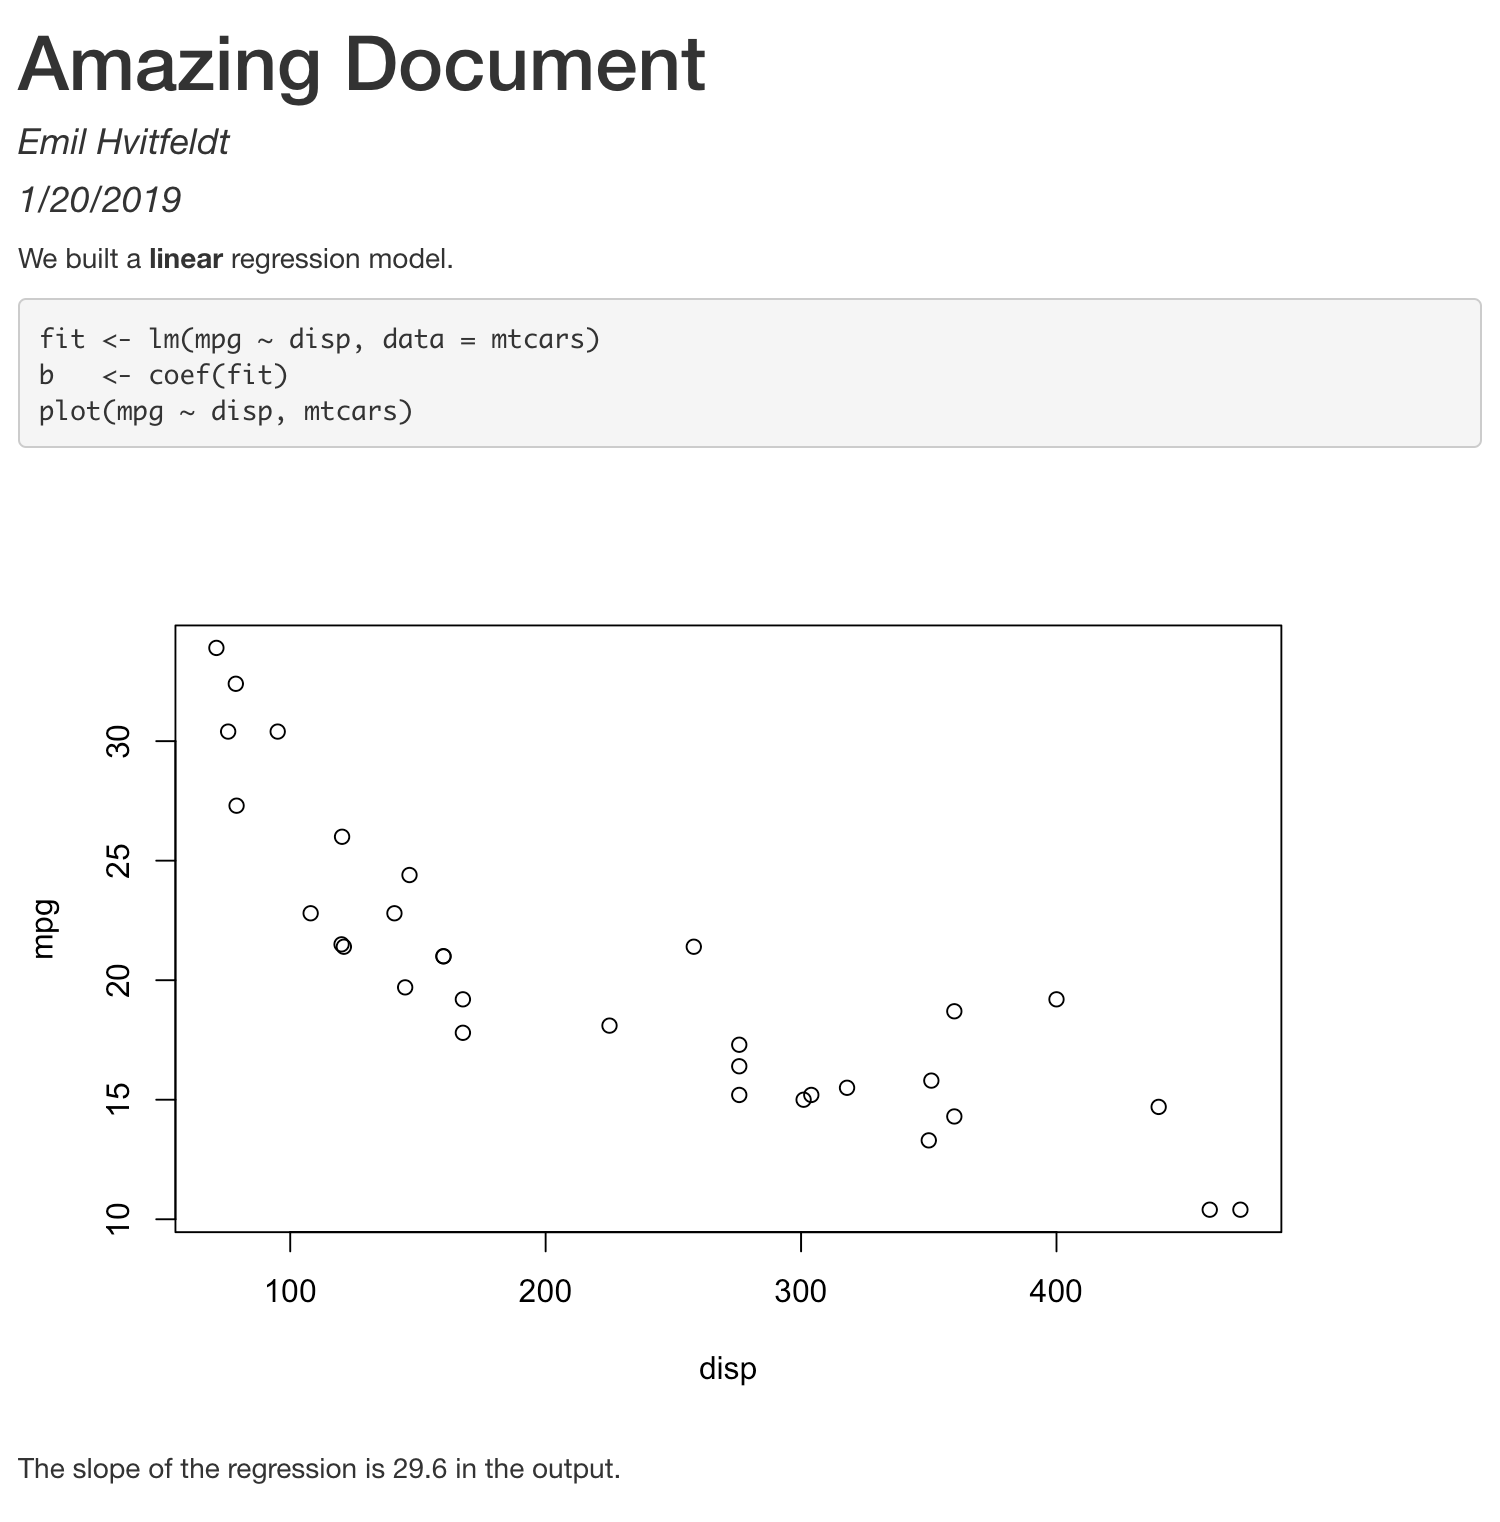 ] --- .pull-left[ **What we write** ```` --- author: "Emil Hvitfeldt" date: "1/20/2019" output: pdf_document --- We built a **linear** regression model. ```{r} fit <- lm(mpg ~ disp, data = mtcars) b <- coef(fit) plot(mpg ~ disp, mtcars) ``` The slope of the regression is `r round(b[1], digits = 1)` in the output. ```` ] -- .pull-right[ **What we get** 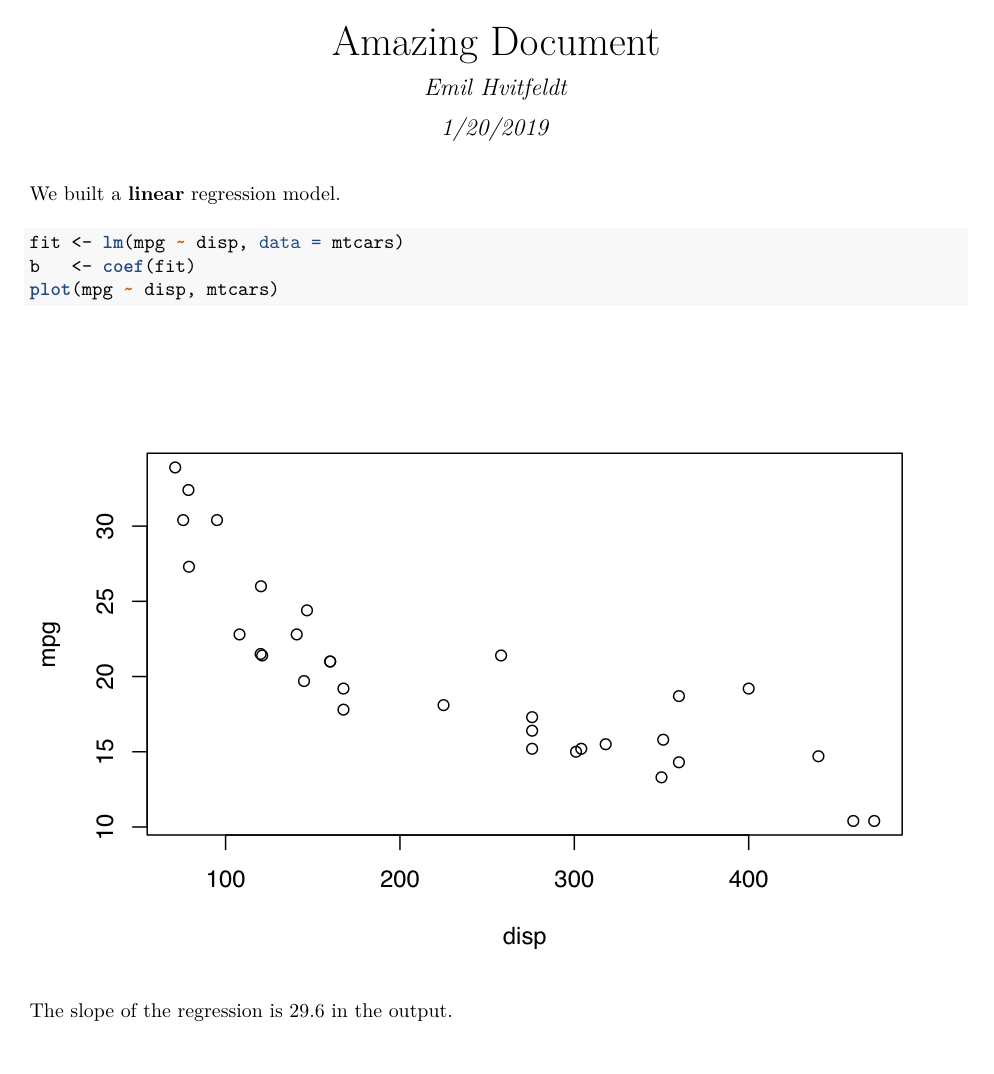 ] --- # Build-in Formats .pull-left[ - github_document - html_document - latex_document - md_document - odt_document - pdf_document - rtf_document - word_document ] .pull-right[ - ioslides_presentation - powerpoint_presentation - slidy_presentation - beamer_presentation ] --- # Notable Extensions -- - xaringan -- - flexdashboard -- - learnr -- - rticles --- 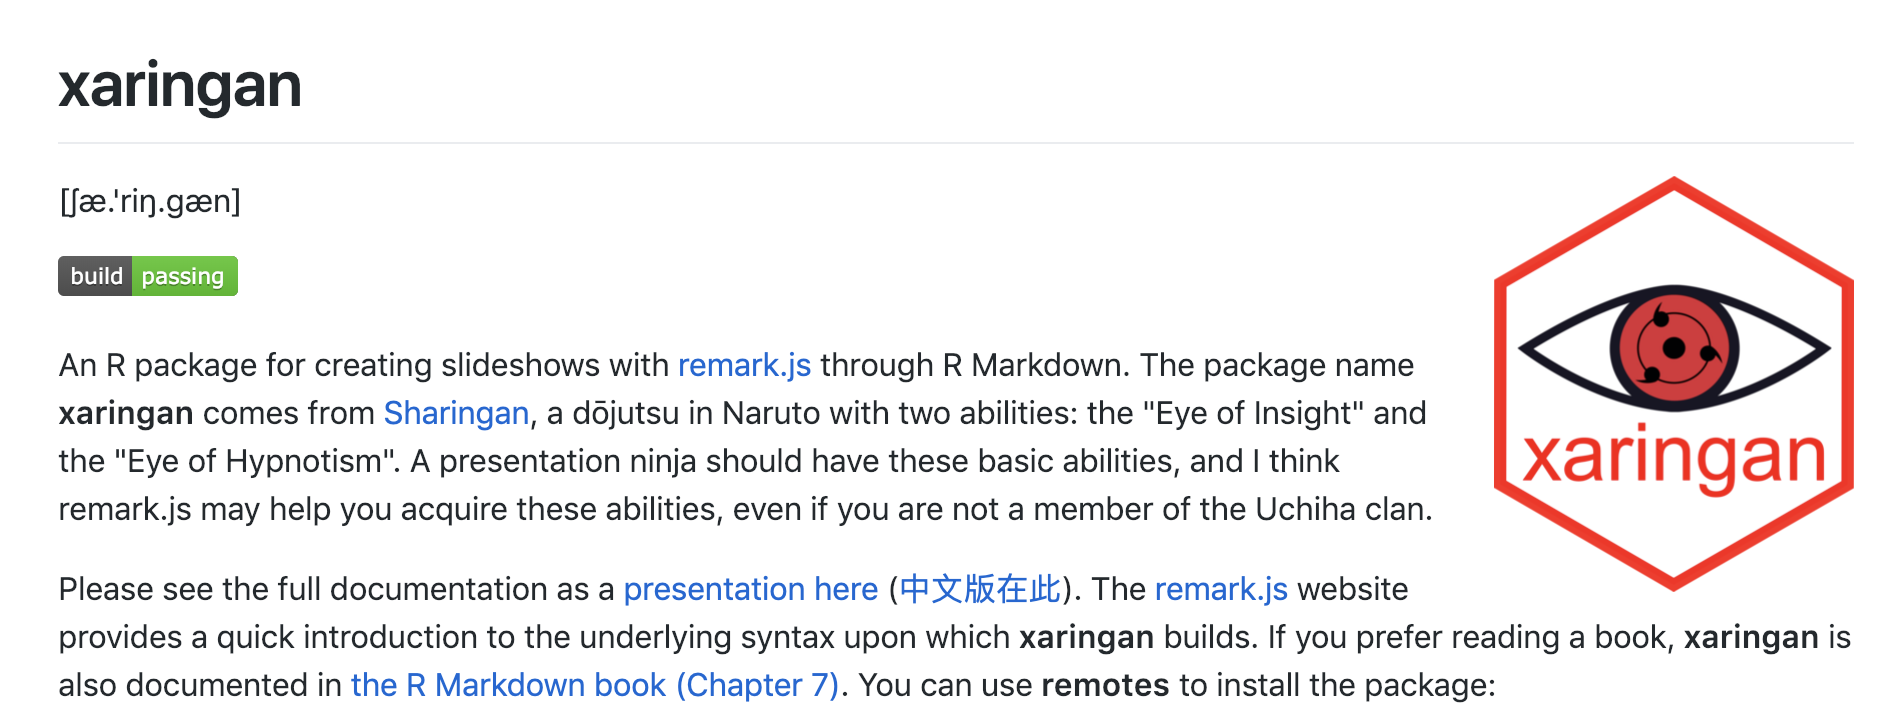 <br> .center[https://github.com/yihui/xaringan] --- <iframe src="https://rawcdn.githack.com/USCbiostats/software-dev/master/happy_scientist/seminars/2019-01_rstudio-and-r/material/Slides.html" width="100%" height="100%" frameBorder="0"></iframe> --- 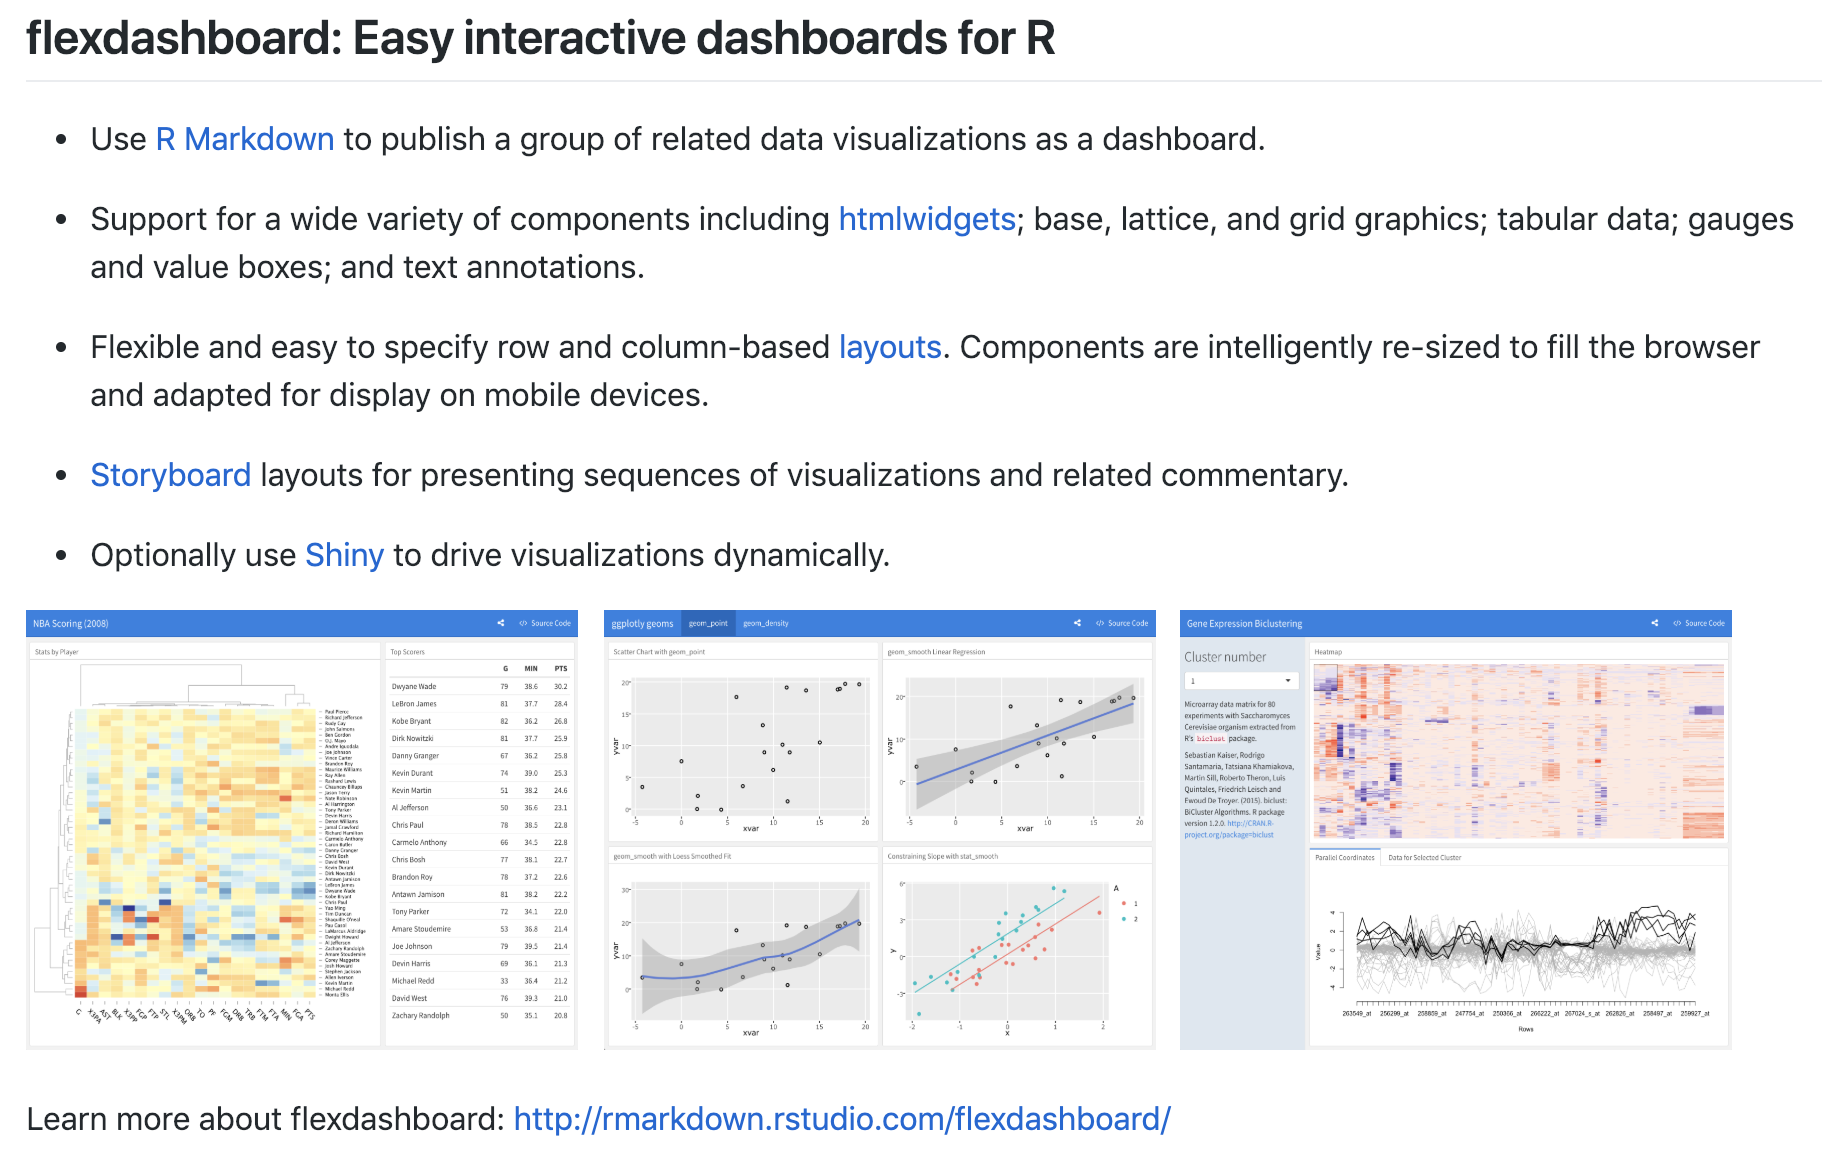 --- <iframe src="https://beta.rstudioconnect.com/jjallaire/htmlwidgets-highcharter/htmlwidgets-highcharter.html" width="100%" height="100%" frameBorder="0"></iframe> --- 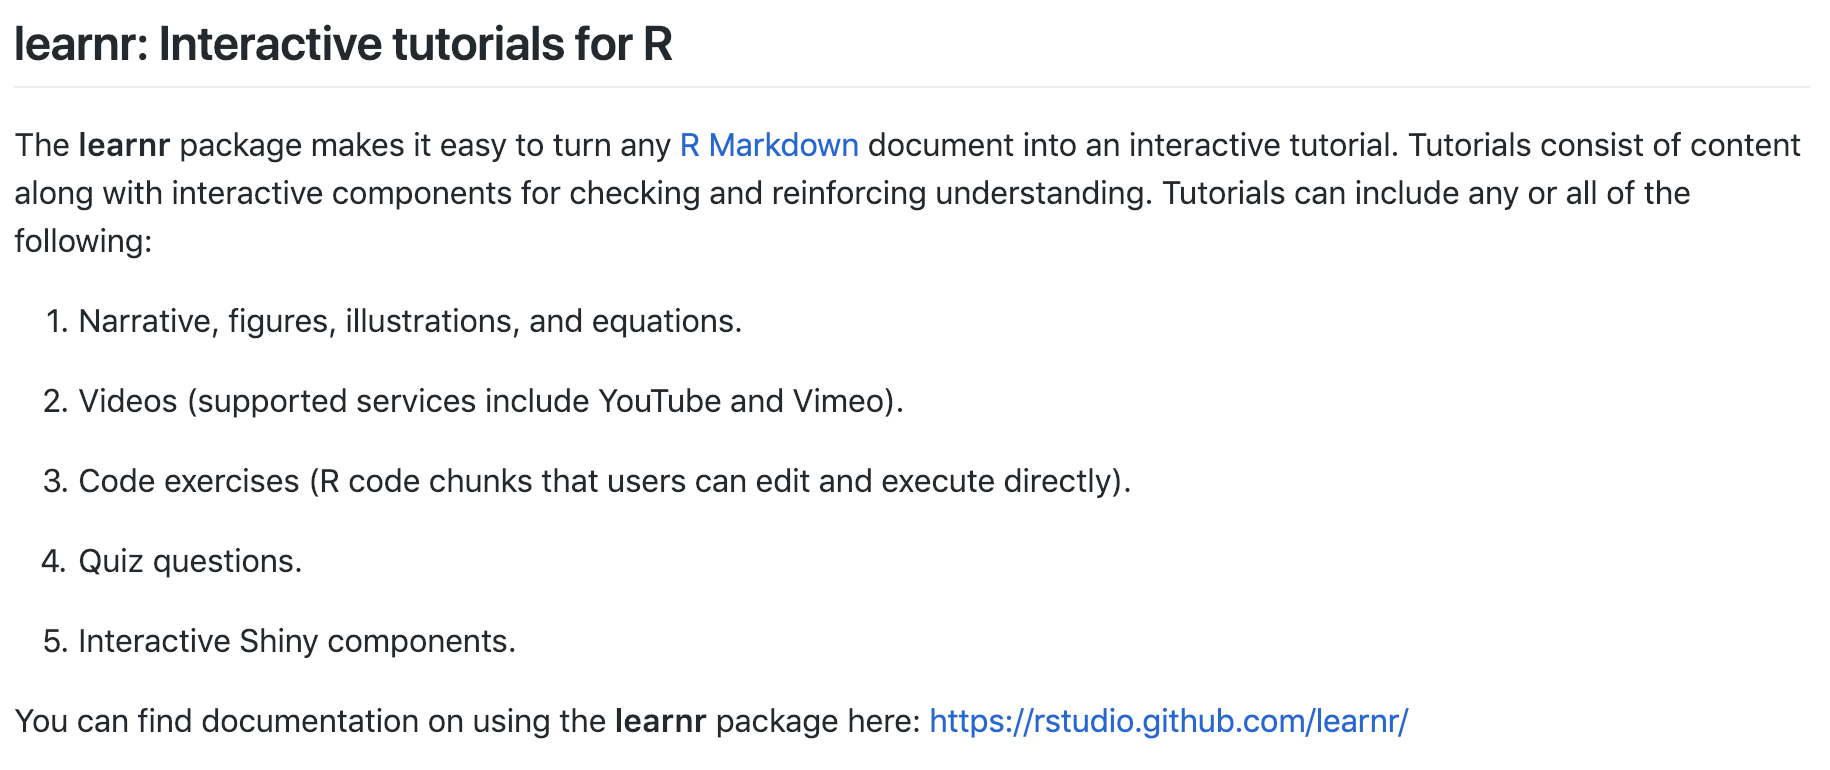 --- <iframe src="https://jjallaire.shinyapps.io/learnr-tutorial-03a-data-manip-filter/" width="100%" height="100%" frameBorder="0"></iframe> --- 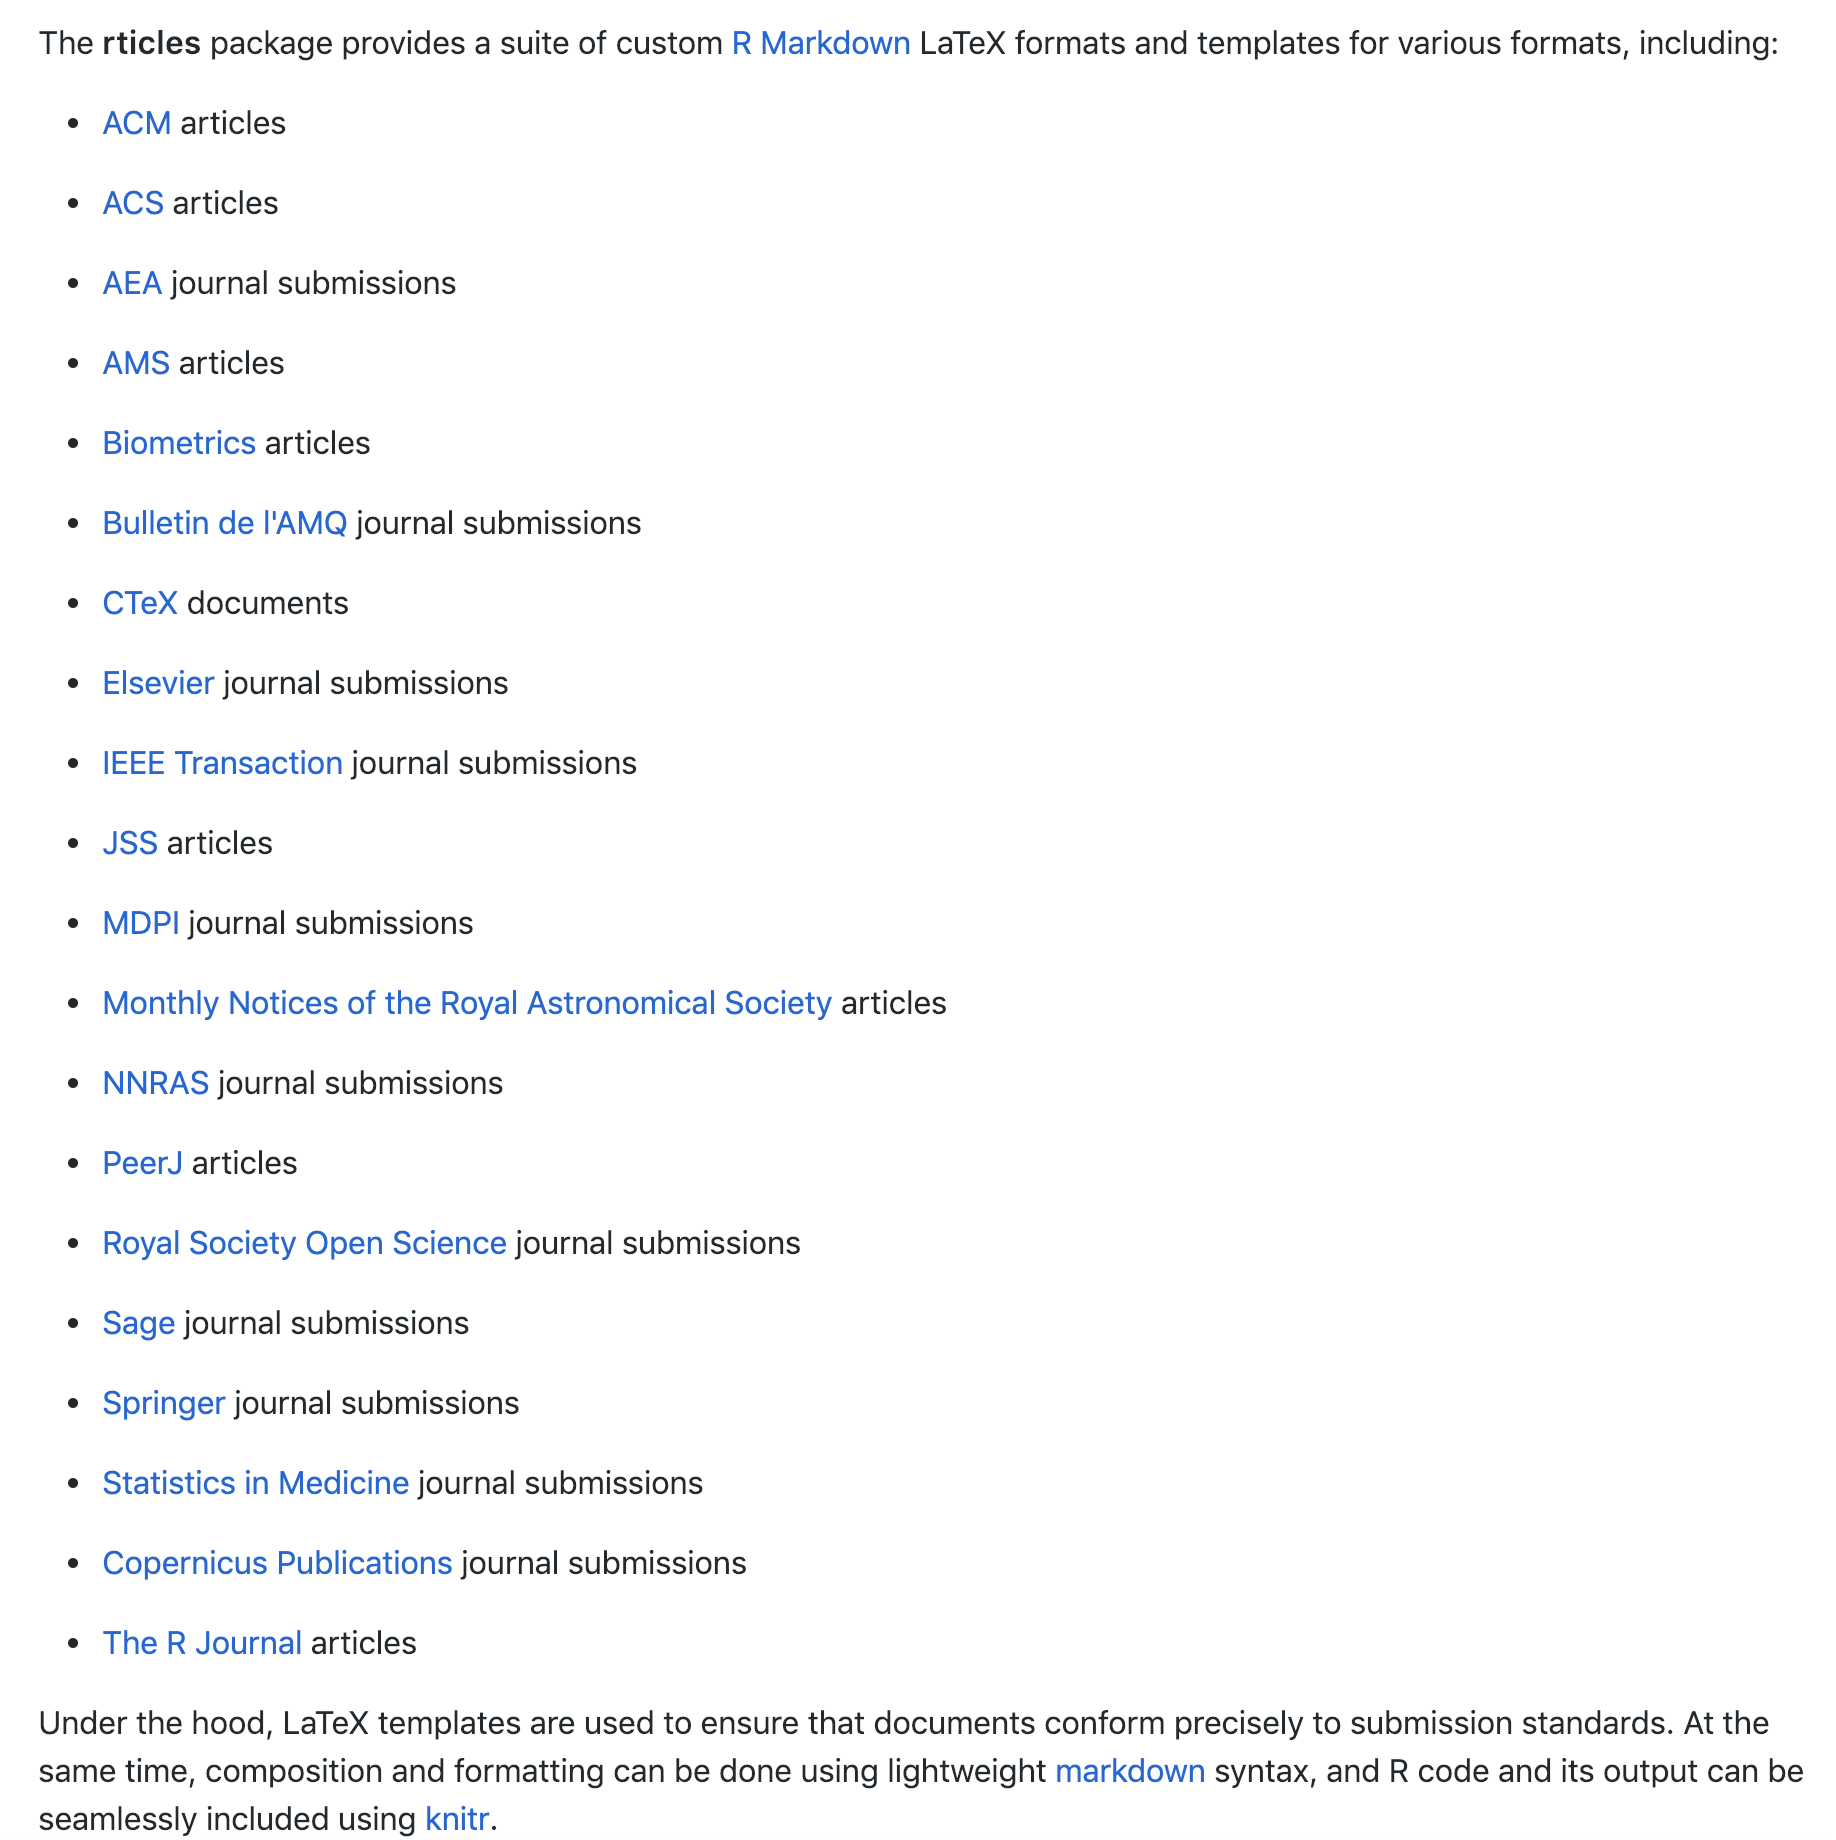 --- # Shiny <img src='https://raw.githubusercontent.com/rstudio/hex-stickers/master/PNG/shiny.png' align="right" height="139" /> Combines the computational power of R with the interactivity of the modern web. Powerful web framework. --- .center[https://gallery.shinyapps.io/050-kmeans-example/] <iframe src="https://gallery.shinyapps.io/050-kmeans-example/" width="100%" height="100%" frameBorder="0"></iframe> --- .center[https://gallery.shinyapps.io/082-word-cloud/] <iframe src="https://gallery.shinyapps.io/082-word-cloud/" width="100%" height="100%" frameBorder="0"></iframe> --- .center[https://gallery.shinyapps.io/086-bus-dashboard/] <iframe src="https://gallery.shinyapps.io/086-bus-dashboard/" width="100%" height="100%" frameBorder="0"></iframe> --- .center[https://apps.garrickadenbuie.com/rstudioconf-2019/] <iframe src="https://apps.garrickadenbuie.com/rstudioconf-2019/" width="100%" height="100%" frameBorder="0"></iframe> --- .center[http://www.dataseries.org/] <iframe src="http://www.dataseries.org/" width="100%" height="100%" frameBorder="0"></iframe> --- # Where do I go for more information? - Cheatsheets - Books - rweekly.org - Forums - USCbiostats/software-dev --- # Have a question? Google it  .center[https://www.google.com/] --- 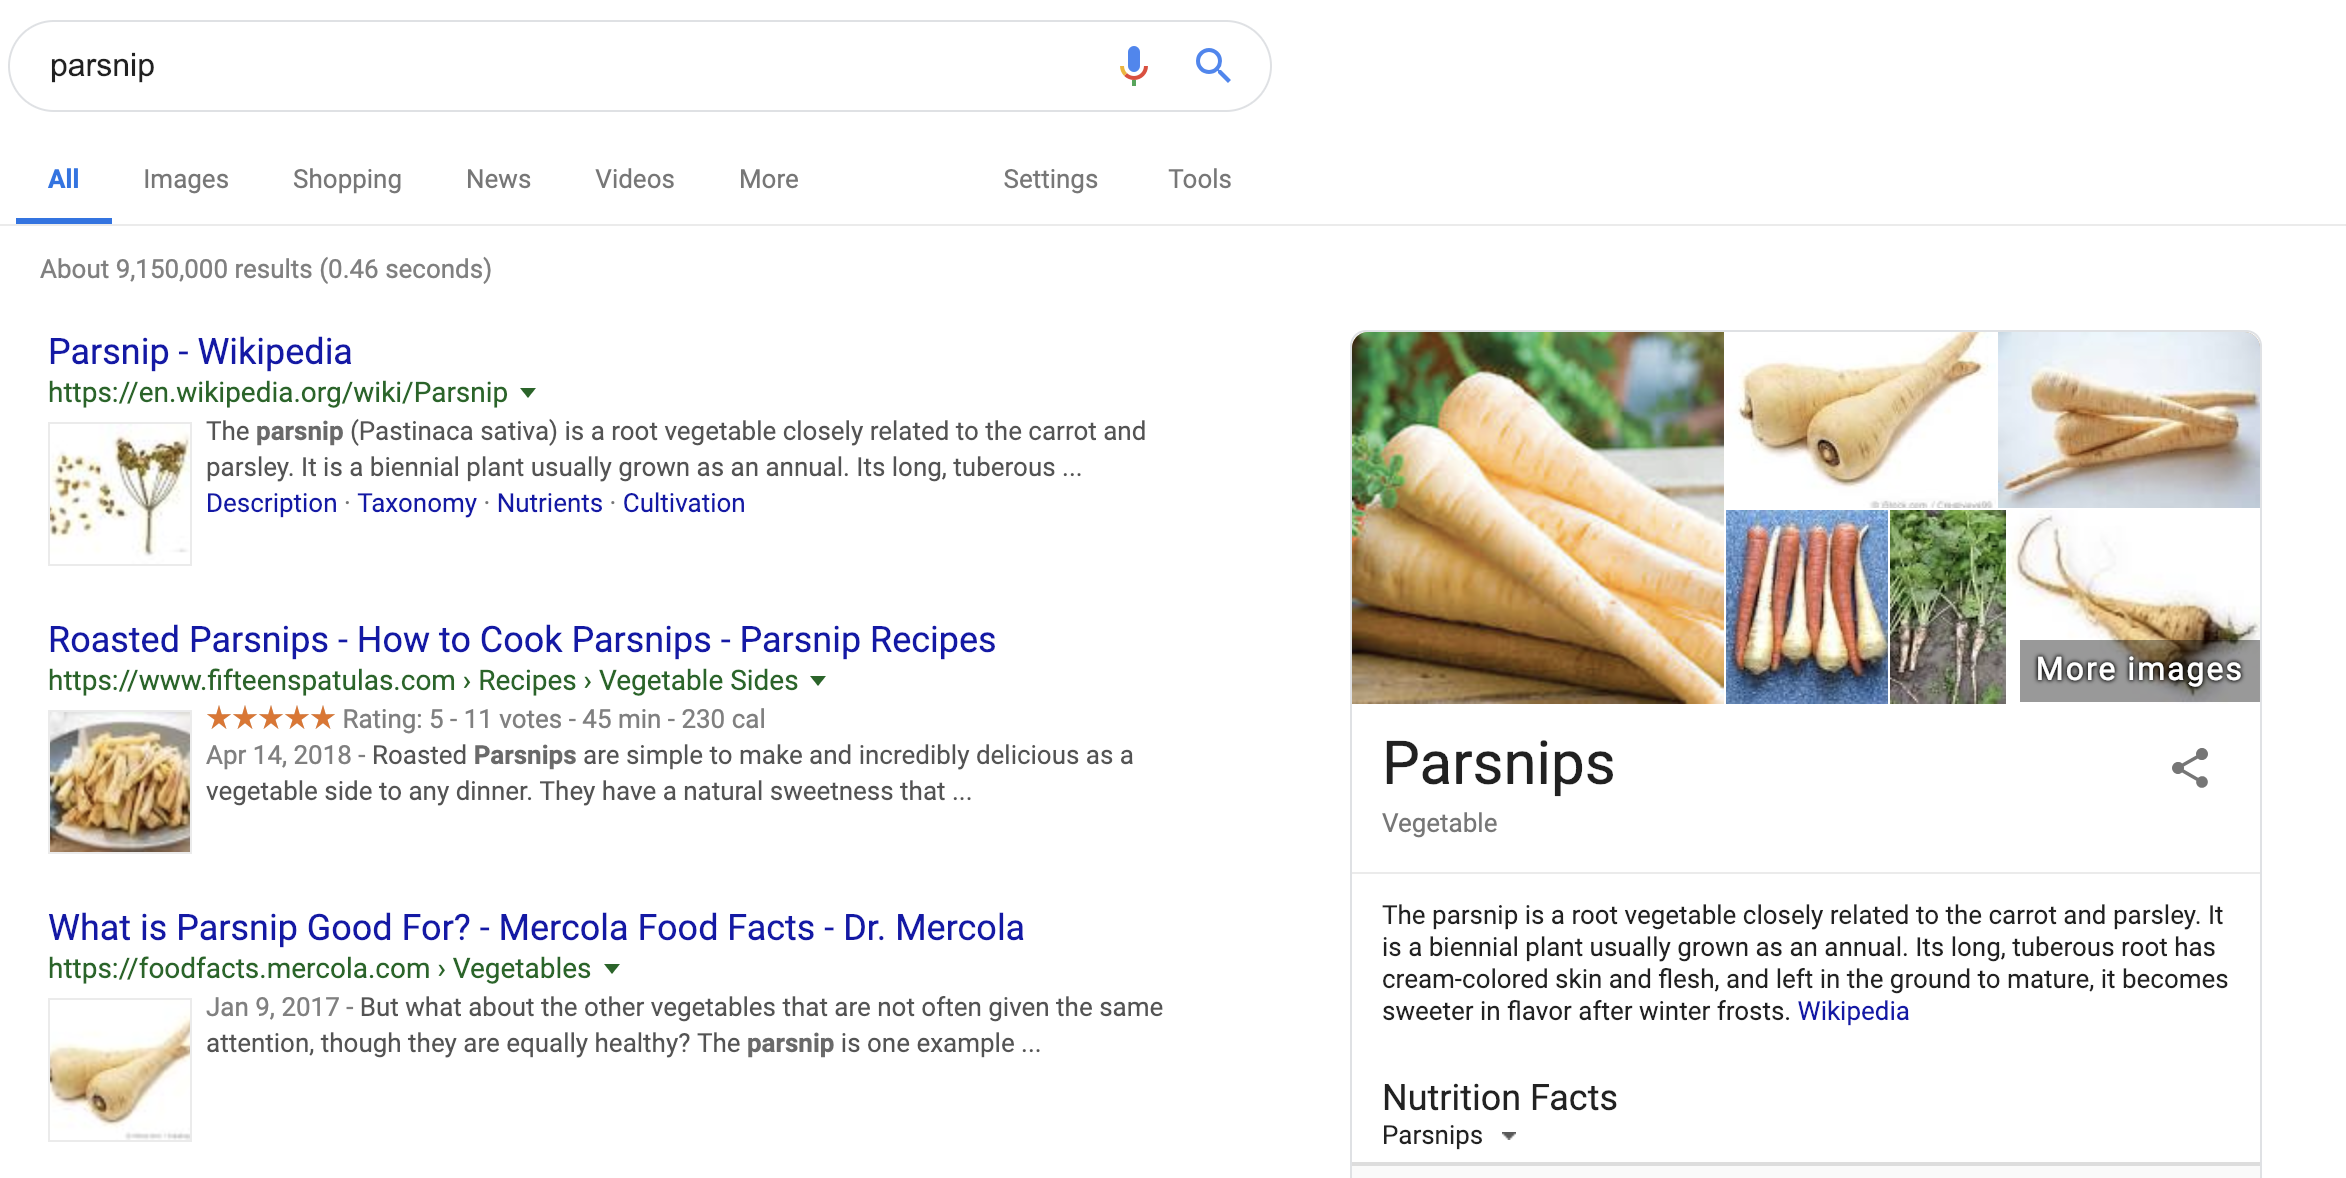 --- .center[https://rseek.org/]  --- .center[https://rseek.org/] 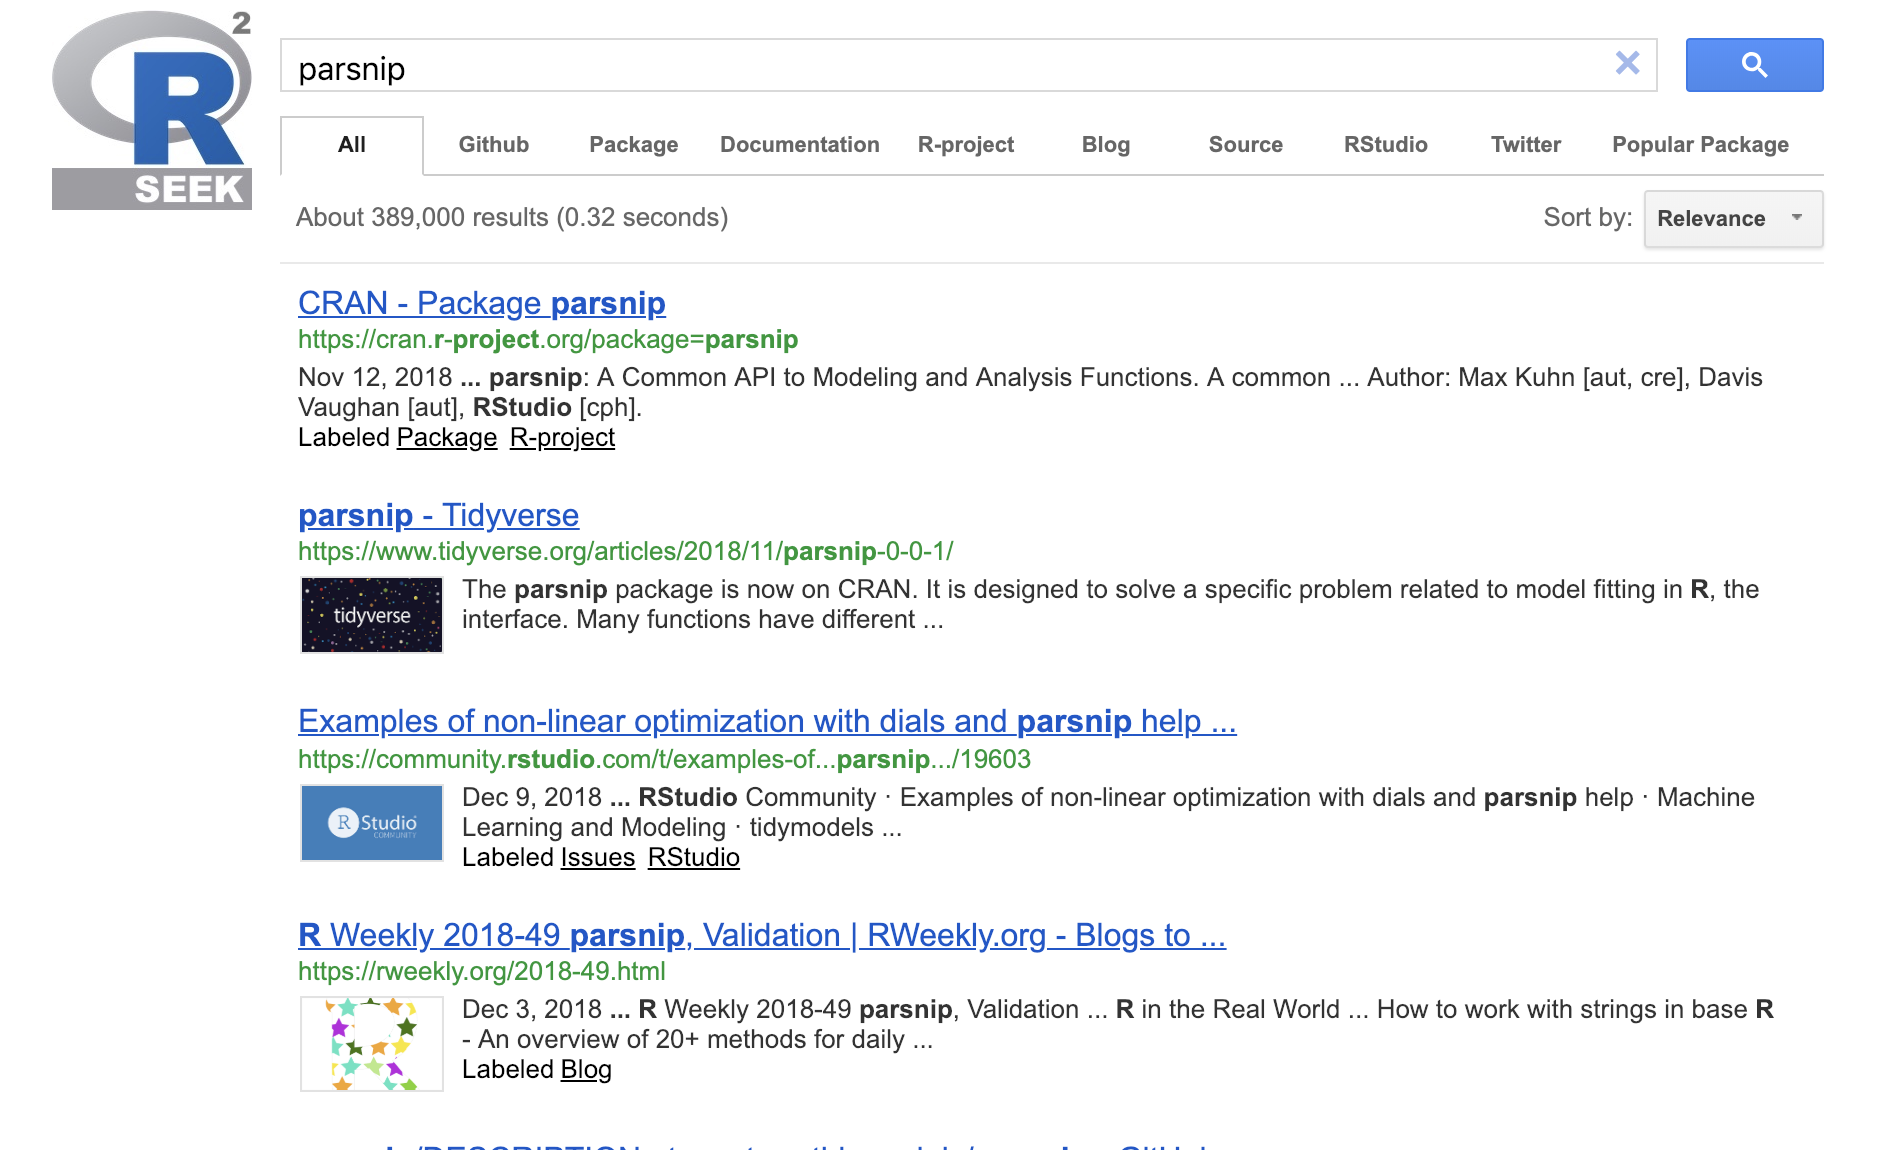 --- # Cheatsheets .pull-left[ 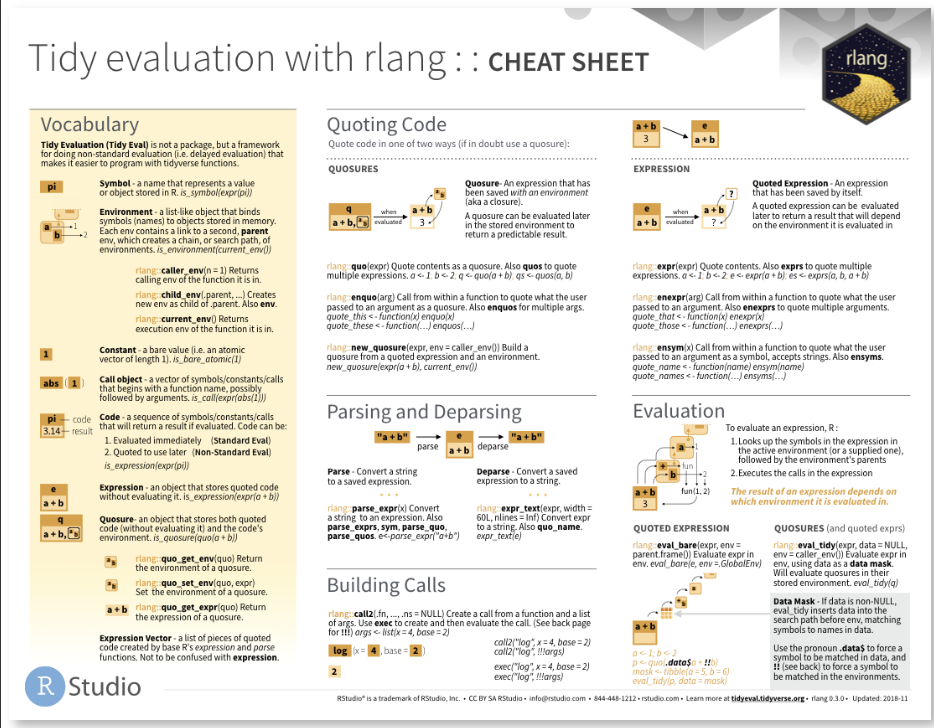 ] .pull-right[ 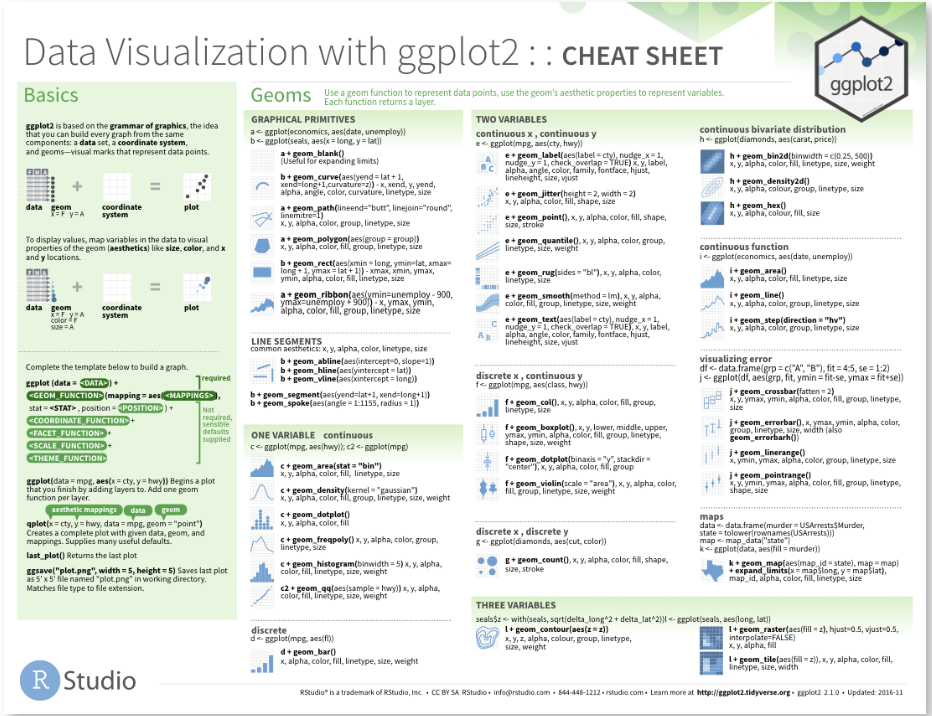 ] .center[https://www.rstudio.com/resources/cheatsheets/] --- # Books .center[https://bookdown.org/] 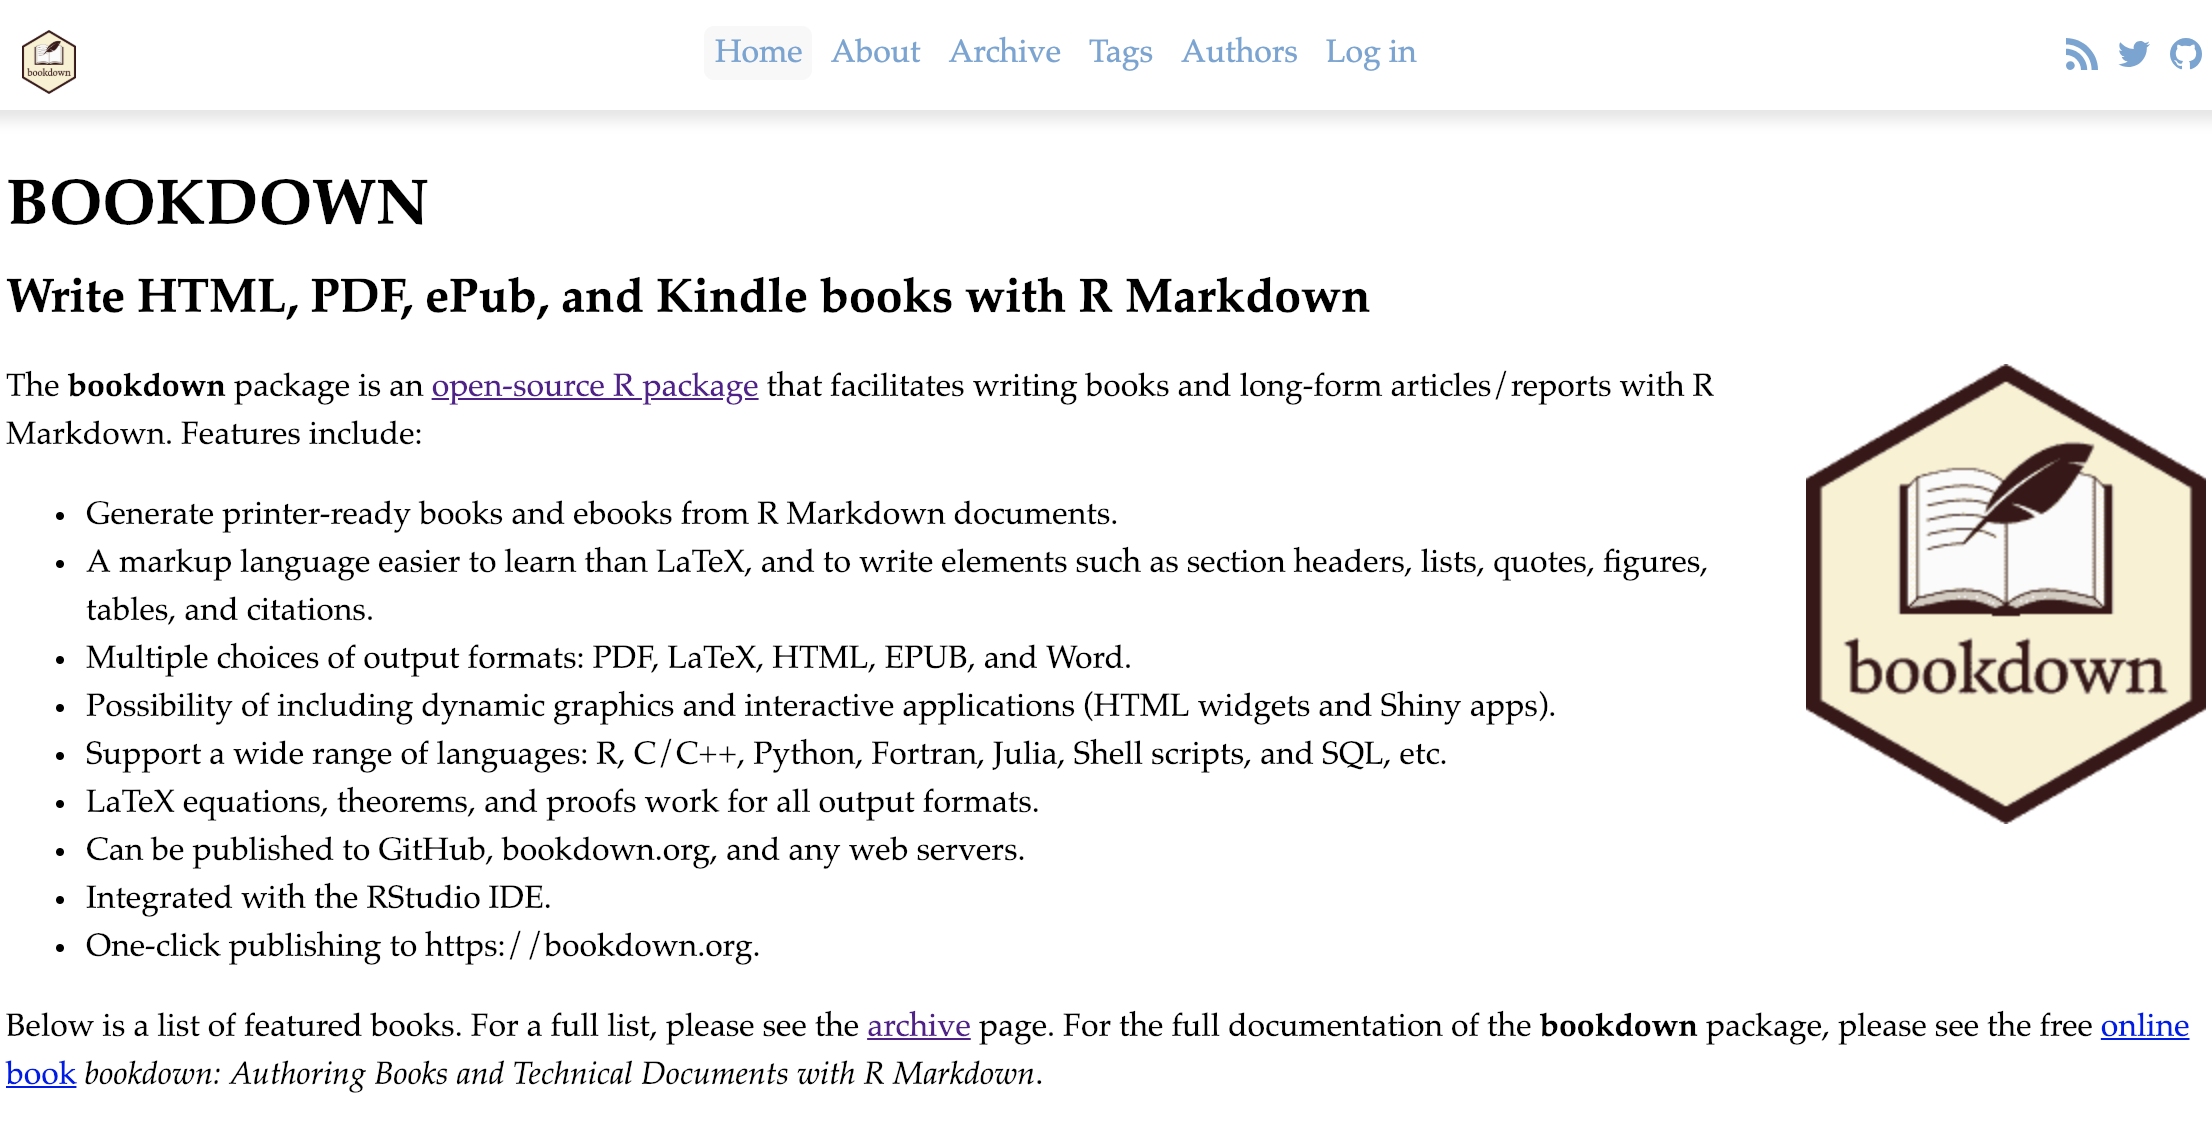 --- # Books 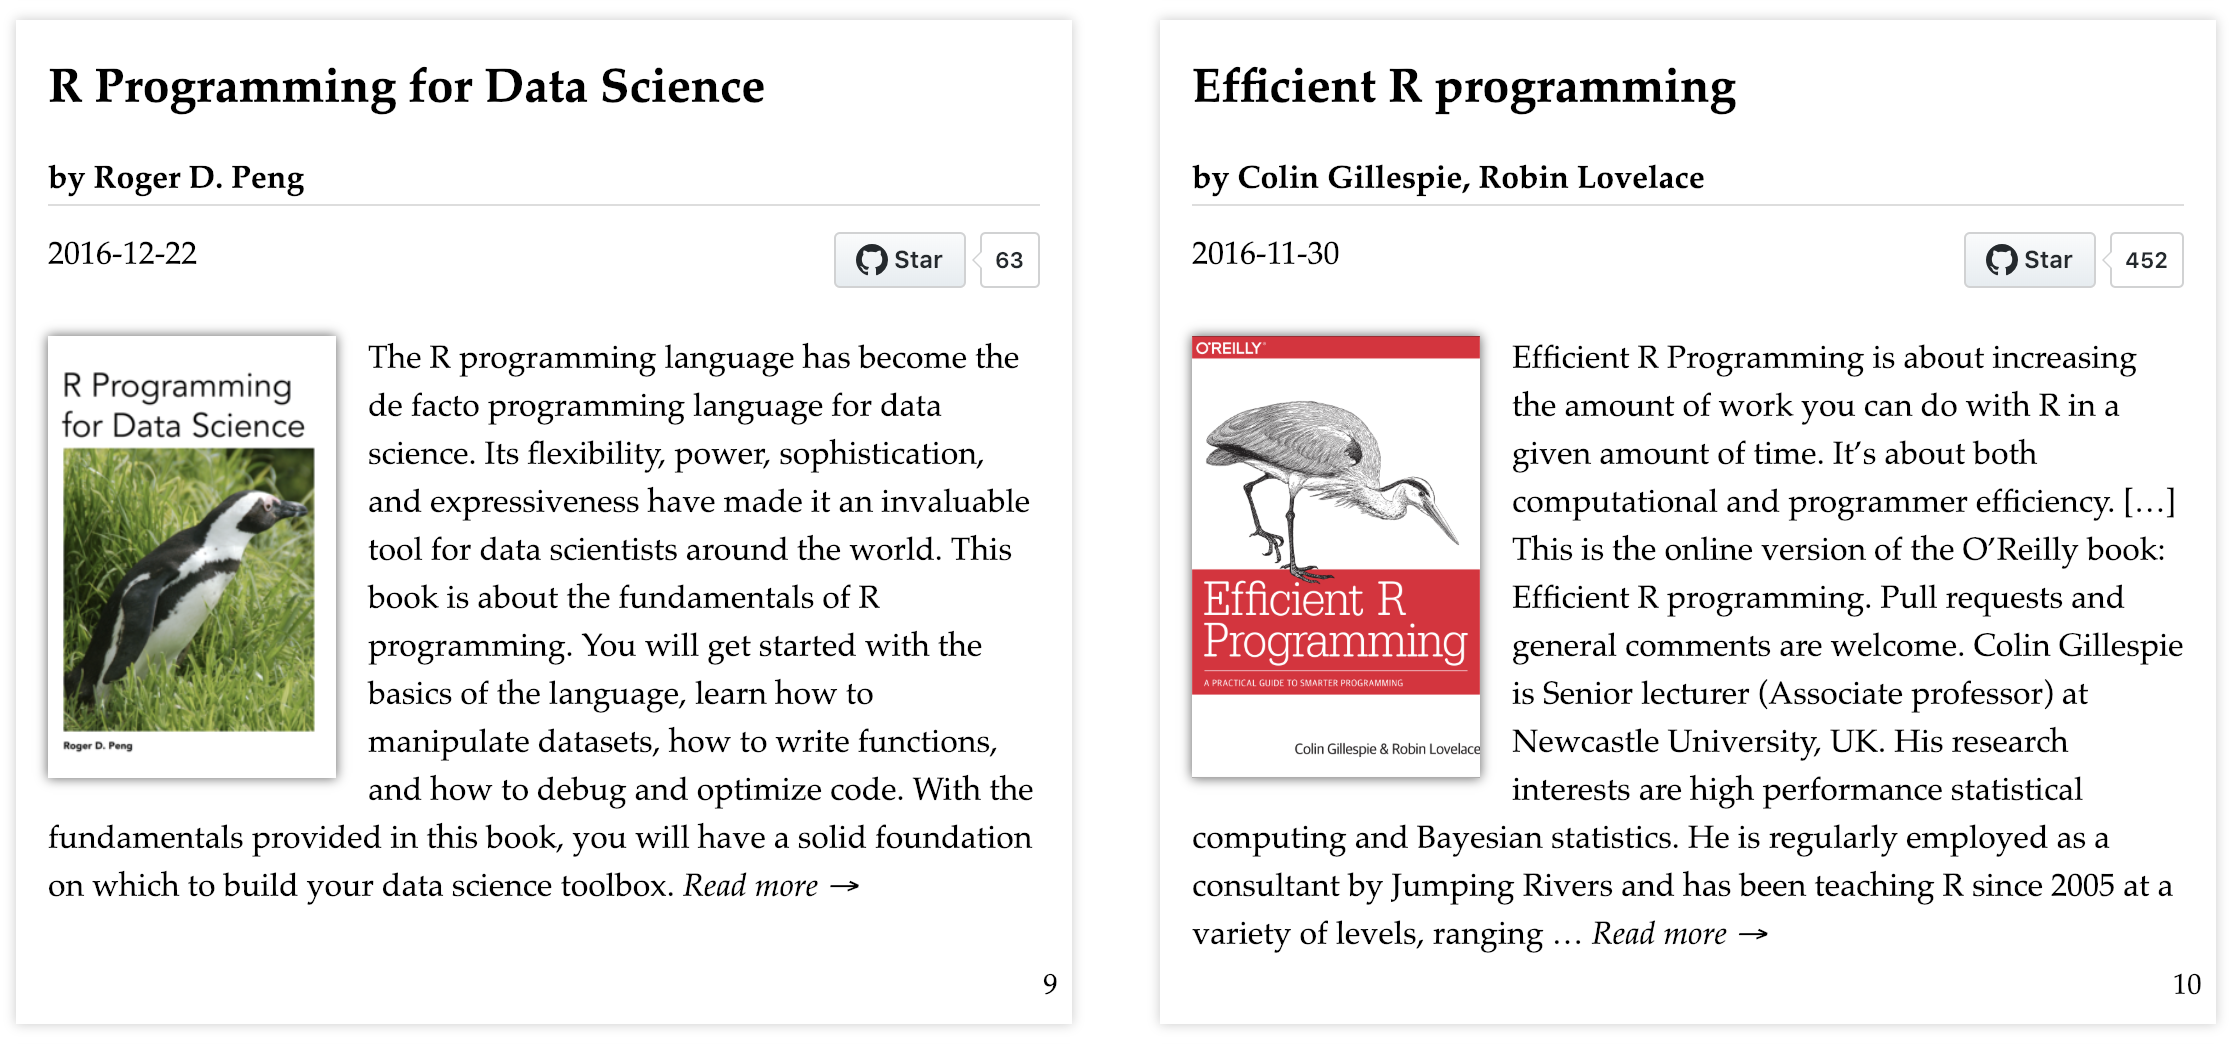 --- .center[https://www.rweekly.org/] 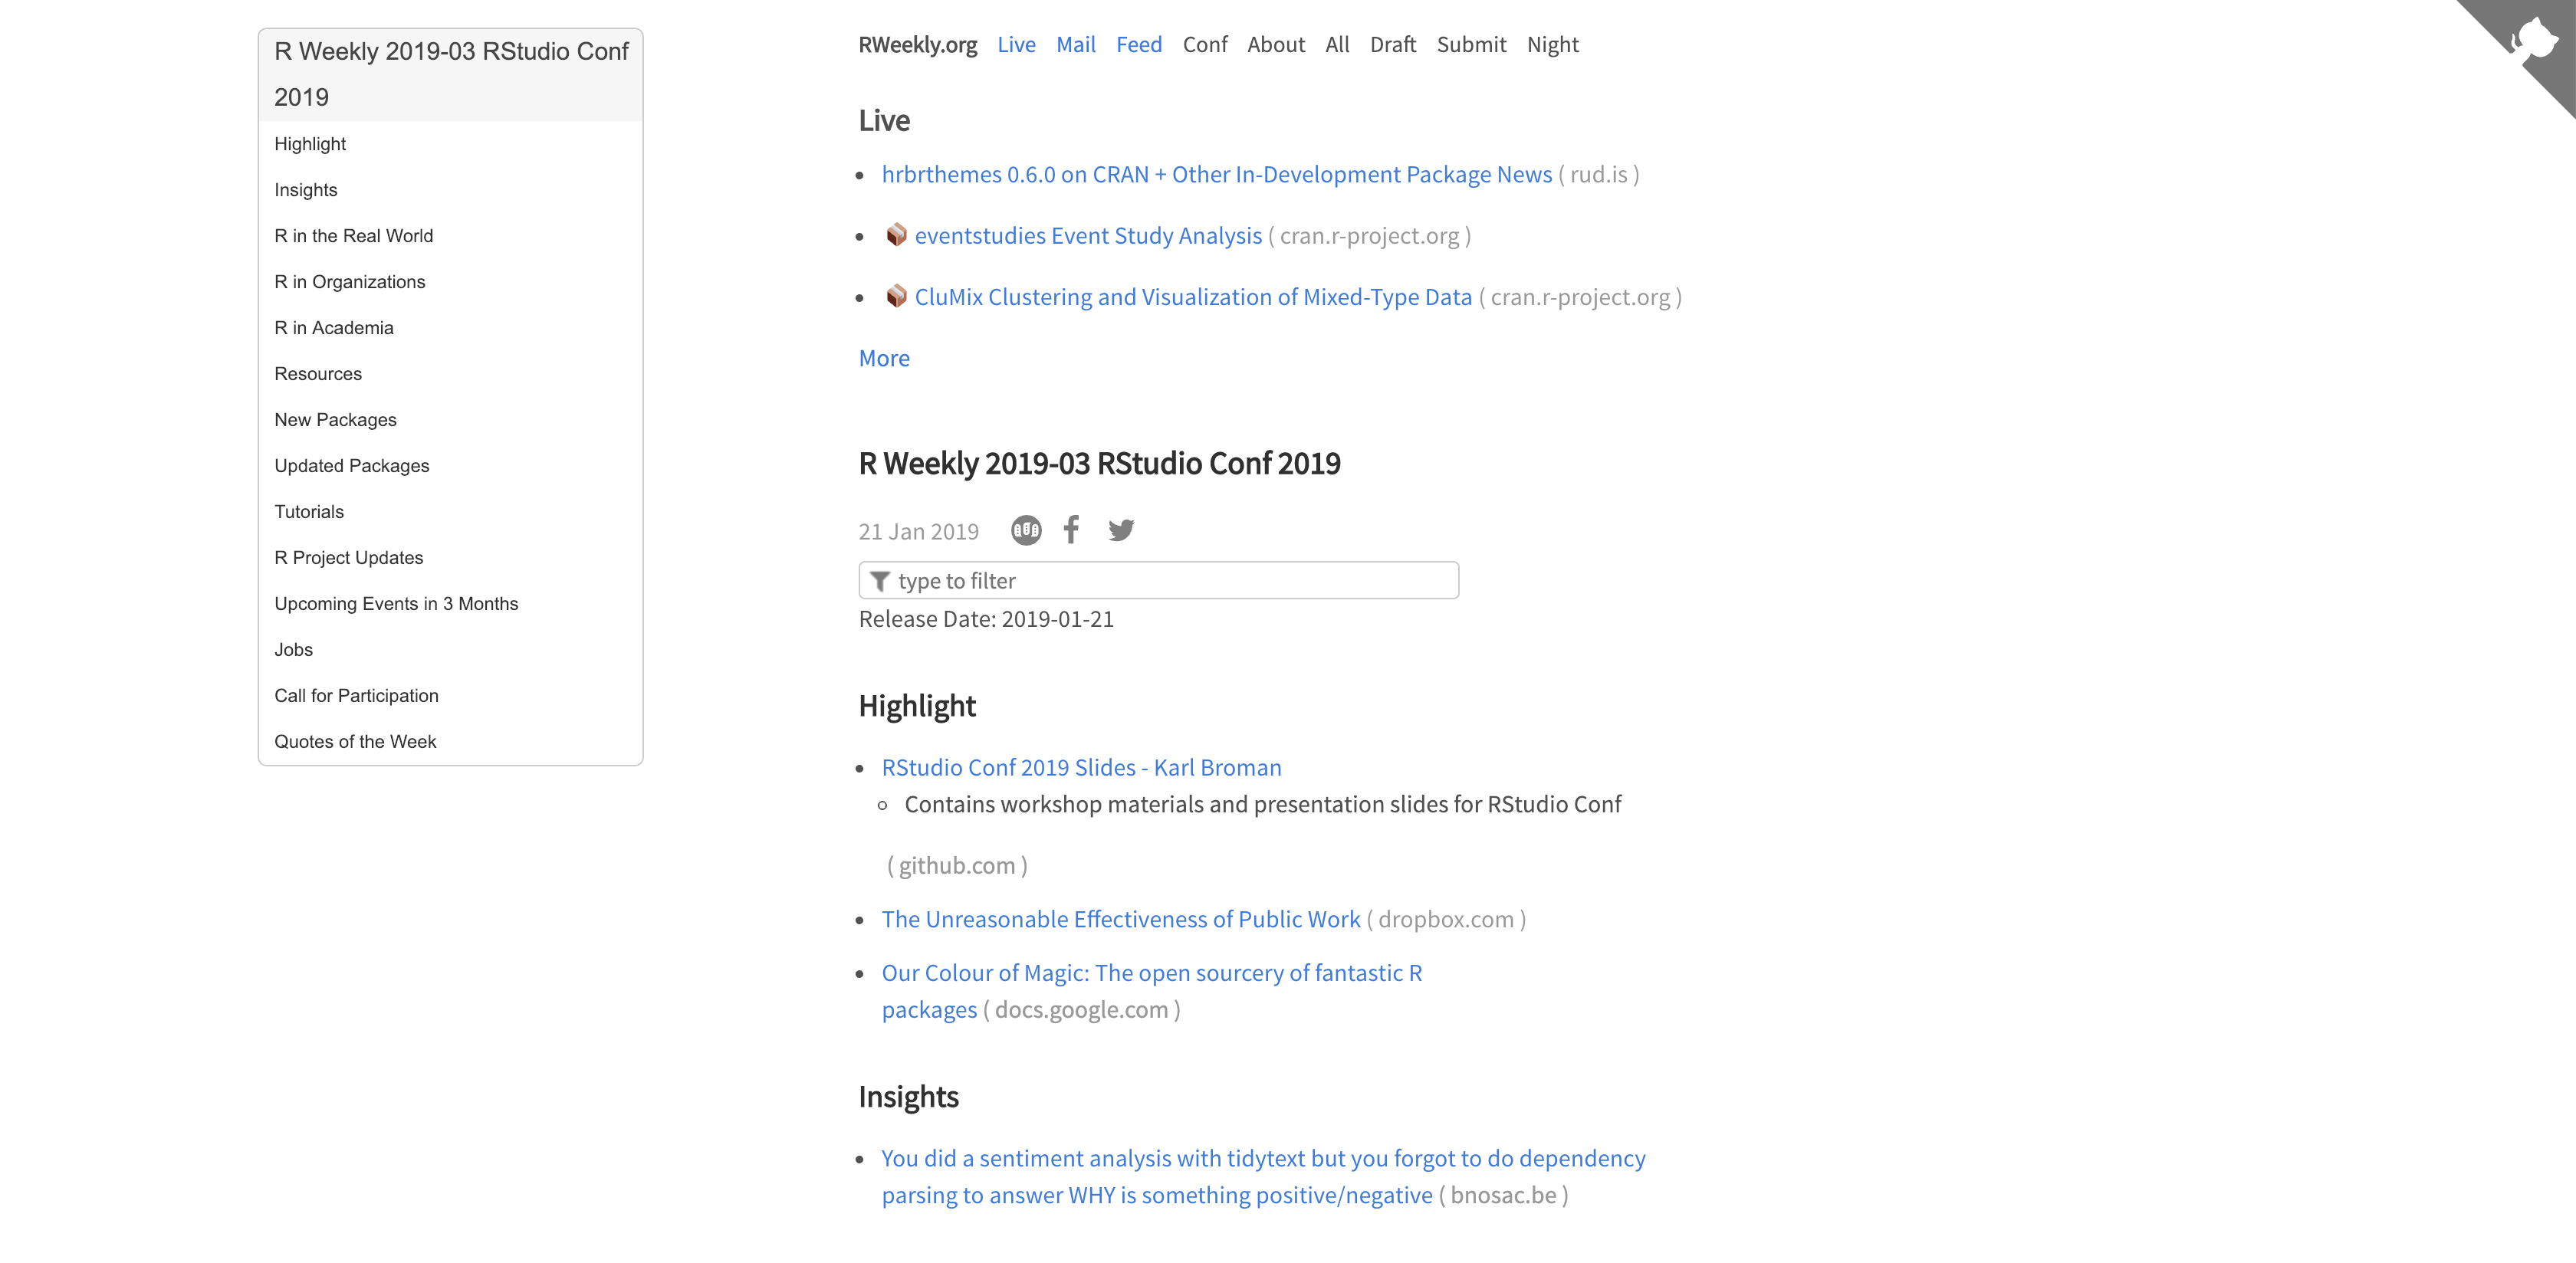 ---  .center[https://community.rstudio.com/] <br>  .center[https://stackoverflow.com/] --- .center[https://github.com/USCbiostats/software-dev] 